Cost of Living in Charlotte is 4% Lower Than National Average

When you’re considering a move to a new city, one of the first things you ask yourself is – how far will my money go?

Apartment List answers that question in a new report and interactive data tool examining differences in cost of living across the U.S. With this tool you can compare cost of living in many of the nation’s largest cities along six dimensions: housing, groceries, utilities, transportation, healthcare, and other miscellaneous goods & services.

Some highlights include:

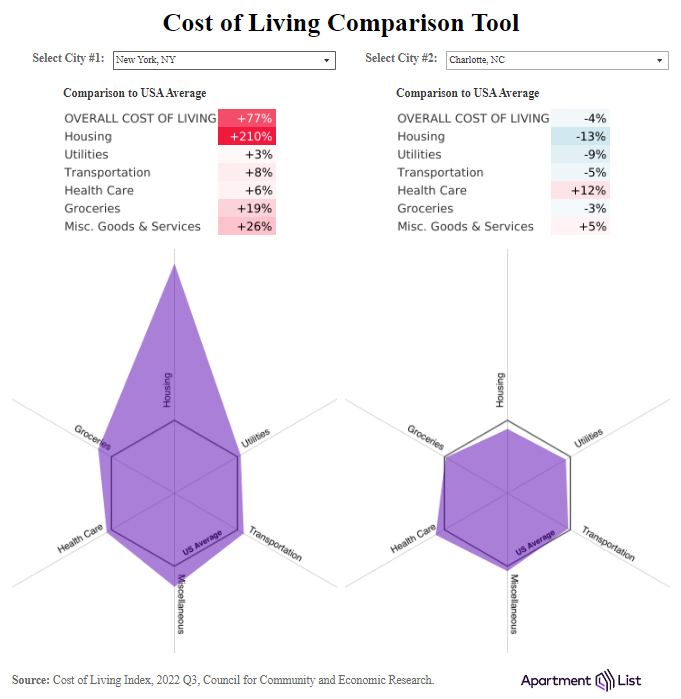
  • The overall cost of living in Charlotte is 4% lower than the national average. This ranks 55th out of the 100 large cities included in the report.
  • Across the county, housing is by far the most impactful expense when it comes to overall cost of living. In Charlotte, housing costs are 13% lower than the national average.
  • As for the other cost of living components: when compared to the national average, groceries in Charlotte are 3% cheaper, transportation costs are 5% cheaper, health care is 12% more expensive, and utilities are 9% cheaper.

Here’s a comparison between New York (where many of transplants are coming from) and Charlotte:

NFL Icon Mike Ditka Opening New ‘Catalina Kitchen’ in Elizabeth Neighborhood

0

Legendary NFL icon Mike Ditka is bringing a new California coastal cuisine restaurant to Charlotte this coming Fall.

Ditka Restaurant Group’s new Catalina Kitchen + Bar will be opening at the new Elizabeth on Seventh mixed-use development in the Elizabeth neighborhood. Other retail tenants include Rosemont Market and Wine Bar, a new concept from the team behind The Crunkleton and the nearby Cheat’s Cheesesteak Parlor.

Office leases at Elizabeth on Seventh have been signed for approximately 34,000 square feet by companies including Lodging Capital Partners, Hord Coplan Macht, and LifeStance Health. In addition, construction of five move-in ready suites totaling 16,000 square feet will offer newly constructed offices to potential tenants. One of the five suites has been pre-leased.

“We are excited by the leasing activity from retail, restaurant, and office users,” said Ned Austin, Vice President of Leasing at Crescent Communities’ Commercial Business Unit. “With state-of-the-art amenities, tenants at Elizabeth on Seventh will be met with a superior, modern office experience that’s unique to the Elizabeth neighborhood. We are eager to meet the market with move-in ready spec suites ranging in size from 2,200 square feet to 4,900 square feet that will deliver in Spring 2023.”

SC’s Comptroller General Resigns After Discovery of $3.5 Billion Accounting Error

Richard Eckstrom, SC’s longest serving Comptroller General, has just submitted a letter of resignation after his $3.5 billion accounting error was brought to light. The error started as a $12 million coding mistake in 2007 and was exacerbated when the state switched accounting systems in 2011.

The crux of the error involved state cash transfers to colleges and universities, which were being double-counted. Despite running unopposed in the last two elections and last facing a challenger in the Republican primary in 2010, Eckstrom’s reputation has been significantly marred by the accounting fiasco.

Auditors claim that Eckstrom overlooked numerous warnings about the issue and took five years to initiate a comprehensive review that ultimately brought the problem to light a year ago.

In recent weeks, the discovery of the accounting error has led state senators to advocate for changing the Comptroller General’s office from an elected to an appointed position. Senate members also presented a resolution to remove Eckstrom from office, with House members slashing his annual salary to a symbolic $1. Impeachment was even contemplated as a possible course of action.

As Eckstrom prepares to leave his post on April 30, South Carolina faces a period of reckoning and reform. The implications of the $3.5 billion error will undoubtedly lead to changes in the way the state manages its finances and the structure of the Comptroller General’s office, marking the end of an era and the beginning of a new chapter in South Carolina.

How Much Vacant Land is There in Charlotte Compared to Other US Cities?

0

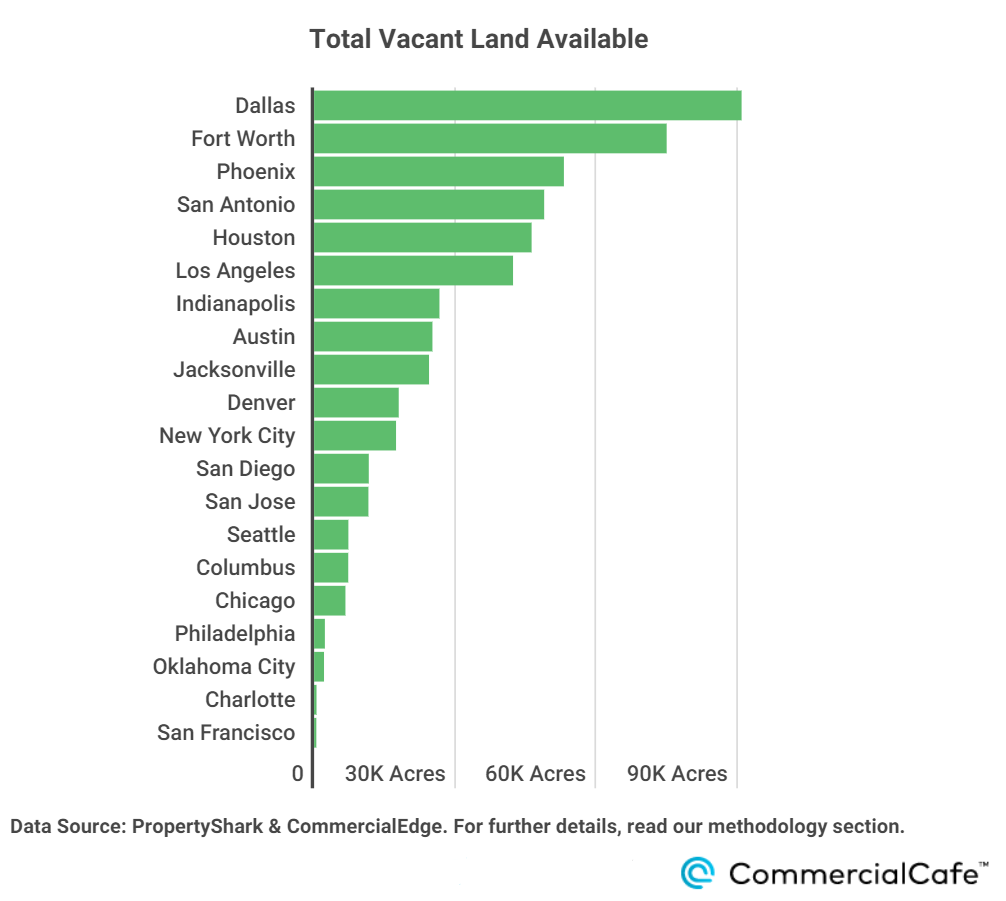
The newest study published by CommercialCafe analyzes how much vacant land is available in 20 of the most populous urban centers in the U.S while also highlighting the construction activity in each area.

For this, our team estimated undeveloped land sizes using the most recent data made available by Property Shark and online government records, and identified local initiatives maximizing land use from CommercialEdge data.

Here are some of the key takeaways:

  • Charlotte had the second-least amount of vacant land among the top 20 most populous U.S. cities: The North Carolina city – ranked 19th – had a total of 512 acres of undeveloped tracts accounting for 84 parcels of undeveloped land.
  • Here, the average parcel size of 6.09 acres, highest among the top 20.
  • In contrast, Dallas leads the list with a whopping 90,739 acres across more than 30,000 parcels.
  • At a regional level, cities across the South and Southwest boast tens of thousands of acres of undeveloped lots each.
  • Among the 20 cities, there are 516,980 acres of land currently still awaiting development – with the average lot size resting at roughly 1.22 acres.

Duke Energy To Help Charlotte Customers Go 100% Renewable

Duke Energy has proposed a major expansion to its Green Source Advantage (GSA) program, giving Charlotte customers the option to supplement their power usage with 100% renewable power – and the ability to pair renewable projects with energy storage.

Details for the GSA Choice program were outlined in a filing with the North Carolina Utilities Commission.

“Many of our large business customers seek renewable power sources and are making decarbonization a long-term part of their business plans,” said Lon Huber, Duke Energy’s senior vice president, Pricing and Customers Solutions. “Duke Energy is proud to offer these customers a wide range of options including the ability to increase their hourly use with carbon-free energy in one of the country’s first time-aligned clean-energy programs.”

Duke Energy’s GSA program was launched in 2017, and has been used by customers such as the City of CharlotteBank of AmericaWells Fargo and Duke University. The changes build and expand on that program.

Up to 4,000 megawatts of capacity will be available under the GSA Choice program, which is more than 10 times the capacity now available. It will provide customers a path towards having 24×7 clean energy. It allows large customers to offset their power purchases by securing renewable energy from projects connected to the Duke Energy grid. The customer may count the renewable energy generated to satisfy their sustainability goals.

Among the changes to the program:

  • Customers can contract for up to 100% of their energy use. Previously, the program’s details only allowed for about 30% of total energy use.
  • Customers can work directly with Duke Energy or independent developers for their long-term purchase of renewable energy.
  • Customers may also combine energy storage with their project – allowing them to align the production of renewable energy with their energy load.
  • Duke Energy is also proposing a new 10-year avoided cost bill credit option in addition to the existing hourly, 2-year and 5-year options.

Clean Energy Impact

Another program being proposed – Clean Energy Impact – is ideal for customers who  want to claim a certain percentage of renewable energy through environmental attribute purchases in support of corporate sustainability goals, or for residential customers that would like to support the local renewable energy industry.

The program with feature locally source renewable energy certificates (RECs); month-to-month contracts with no long-term commitments. Clean Energy Impact will be available to residential customers, who can purchase renewable energy to match their energy use at the level of their choosing. It will be ideal for renters, or customers who aren’t able or looking to install solar.

“We’re continuing to fine-tune our renewable energy options for all customers and are looking at programs such as community solar in the future. That will allow customers to directly subscribe to the output of a solar facility,” added Huber.

To learn more about these programs, business customers can visit here, while residential customers can find more information here.

Why Is the Price of Gas Falling?

0

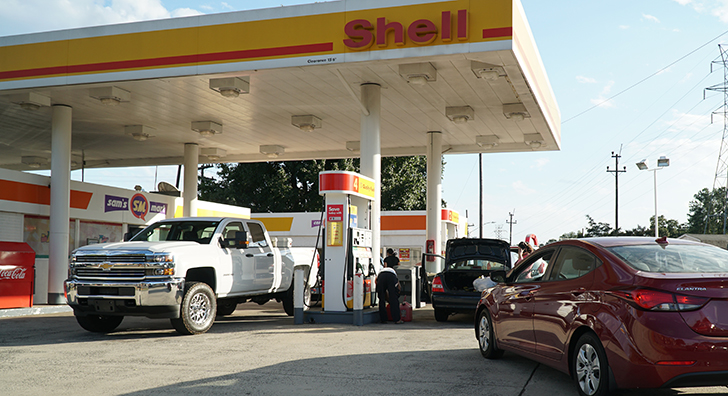
According to AAA, which analyzes gas prices, the national average price for regular gasoline as of March 9 was $3.467 per gallon. Compared to some of this year’s pricing, it’s a significant bargain. 

The price reduction is most noticeable when comparing the current average to peak pricing; it had decreased by 37% from June 2022, when the average gallon price was $5.006 in the United States, according to statistics from the EIA.

It’s still less expensive when you go further back and contrast current pricing with those from early March of the previous year. According to AAA data, the average price of petrol is currently around 28 cents less expensive than it was a year ago. 

What Causes Price Drops?

Several factors have contributed to the drop in gas prices.

In the commodities market, it’s a well-known adage that high prices are the cure for high prices. And it has come to pass. In other words, low demand reduces price increases as a result of high pricing. Due to high fuel prices, drivers had to look for how to get a personal loan guide by Trice or other sources of extra cash to manage some money to fill up their cars.

Although some driving is necessary—for example, to go to work—with costs at record highs, consumers may opt against going on a road trip or to carpool with friends instead. Government consumption statistics, which indicate a decline in demand, have revealed this to be the case.

Additionally, some states have halted their gas taxes, artificially bringing down costs. However, the drop in oil prices is the primary cause of the downturn. Crude makes up more than 50% of the cost of gasoline, making it the single biggest factor affecting pricing.

After Russia invaded Ukraine in March, the U.S. oil benchmark West Texas Intermediate crude surged beyond $130 per barrel, rocking the world energy markets. WTI traded at that price for the first time since 2008. However, since that time, both oil and gasoline prices have declined.

China’s demand has also been weak as it fights Covid instances there. Additionally, in a bid to restrain rising oil prices, the United States has taken unprecedented action by releasing record volumes of oil from the Strategic Petroleum Reserve.

In the run-up to the 2017 midterm elections, the cost of gasoline has become a significant issue for the White House, and President Joe Biden has frequently stated that his government is doing everything it can to make life easier for customers.

Which Way Are Gas Prices Going?

The majority of analysts do not anticipate a short-term price increase unless an unexpected event occurs, such as a major hurricane that stops oil production in the Gulf of Mexico or floods refineries along the Gulf Coast. Even if hurricane season is still in effect, that has happened previously. To reach 223.6 million bbl, the total domestic gasoline stockpiles increased considerably by 4.5 million bbl.

The countrywide average gasoline price decline that has lasted for the past 58 days may shortly halt. In addition to the storm threat, refineries will need to slow down because they have postponed maintenance work, and that work cannot be postponed indefinitely.

How Much Will Gas Prices Decline?

U.S. gas prices can be greatly impacted by several factors: the global economy, demand for oil and gas, running of refineries and pipelines, the fuel blend federal regulations, taxes imposed on fuel consumption rates, weather conditions as well as geopolitics situations in different countries. The resulting changes are often drastic – take June 2020’s record-high average price of a gallon, just above $5 compared to today, where it is more than $1.80 cheaper!

With petrol prices on the down, Americans may resume their usual driving patterns, which would boost demand. In general, we can see that the statistics reflect a steady downward trend in gasoline prices, which saves drivers a lot of money.

Source: https://gasprices.aaa.com/pump-prices-rise-slightly-but-still-lower-than-a-month-ago/ 

But as the temperatures start to heat up, so will gasoline prices. The special summer blend of gas is designed to reduce emissions during peak months and requires a more costly refining process, which adds approximately 5-10 cents per gallon of fuel. In light of this expected increase in cost at the pump, motorists should anticipate higher prices throughout the summertime.

How Does the Cost of Gas Work?

Long before the gas arrives at your local station, a number of complicated factors that affect pricing are already in play. According to data from the Mercatus Center at George Mason University in Virginia, consumer confidence in the nation’s economic situation tends to decline as petrol prices rise.

What you should know regarding how gas prices operate is as follows:

At the pump, there are four different gasoline kinds that have varying prices. The octane rating, a gauge of fuel stability, divides standard, midgrade, and premium gasoline into three categories (the pressure at which a fuel will combust in an engine).

  • Regular is the most affordable.
  • Super or mid-grade is less expensive than premium and diesel but more expensive than normal.
  • Most costly non-diesel gasoline is classified as premium or super premium.
  • In vehicles with diesel engines, such as freight trucks and buses, diesel, also known as distillate fuel oil, is utilized. It is the priciest fuel available on the retail market.

Low oil Prices

In the meanwhile, as Wednesday’s market closed, WTI went up by 64 cents to finish at $77.69. The surge in crude prices was caused by a combination of factors. 

The rise of manufacturing activity in China last month indicated that global oil demand might be more active than expected this year. The EIA report stated that domestic and commercial crude inventories rose 1.2 million bbl, reaching 480.2 million bbl over the course of last week were two contributing causes for the sudden spike in price values yesterday evening.

Conclusion

Gasoline prices are plummeting so quickly that they are starting to put actual money back in drivers’ pockets, confounding predictions and providing an unexpected holiday present. Right before Russia’s invasion of Ukraine sparked a worldwide energy crisis, gas prices were as low as they are right now. 

The Benefits Of Installing Solar Panels In North Carolina

0

Solar power is quite a popular investment for most homeowners nowadays, particularly those in sunny states like North Carolina. Between the worsening global warming and higher energy bills, solar energy systems can be a good investment, providing a better alternative than traditional energy sources like fossil fuel.   

If you’re considering a solar panel installation but don’t have enough validation for this investment, this post can help change your mind. In this article, we’ll explore how North Carolina homeowners can benefit from installing solar panels.   

  • It Ensures Maximum ROI   

Generally, several considerations help determine your solar panels’ suitability and maximum return on investment. One critical factor is your location since solar panels work best when they get access to sunlight as much as possible.   

While solar panels can work well in most climates, it’s more effective in some geographical areas than others. States in the southeastern, southwestern, and western get optimum sunshine. In particular, North Carolina is situated in the Southeastern region. It is one of the states that see long stretches of sun, promising an average of 213 sunny days yearly, more than the national average of 205 sunny days.   

With such an ideal location, adding a solar panel to your NC home can be beneficial, offering maximum returns on your investment while also boosting your home’s value. 

  • Falling Costs And Availability of Incentives  

Cost is probably one of the most common reasons homeowners in North Carolina may seem reluctant to install solar panels. After all, the expense of getting solar panels and their installation services can be significant, often discouraging homeowners from considering investing in them. 

Today, the average cost of solar panel installation in the US is USD$16,000 for a 6kW system, while the average cost in North Carolina is over USD$17,000. However, it’d be good to note that the price generally depends on various factors, including size and location. For instance, the cost of solar panels Charlotte companies, like Freedom Solar Power, offer just over USD$38,000 for a 9kW system.   

Moreover, residential solar energy systems continue to drop yearly. In fact, solar prices dropped over 60% in the last decade. Numerous government subsidies also offer cash incentives, discounts, tax breaks, and local rebates that can help lower the overall costs of solar panels, encouraging North Carolina homeowners to turn to solar panels.   

  • Lower Energy Bills 

Saving on energy bills is perhaps the most significant benefit of installing a solar energy system for your home. Considering solar panels generate free electricity from the sun, your household can reduce your dependence on traditional utility providers.  

According to experts, the average US home can save about USD$1,500 yearly from energy bills, depending on the size of the solar energy system, your electricity usage, and location. This can provide you with over USD$30,000 on energy bills over the system’s lifetime.  

In addition, as electricity prices get more expensive yearly, solar energy systems can be useful. Since you’re producing your own energy, you don’t have to pay costly bills from a provider. 

  • You May Gain Profits 

Did you know that adding a solar energy system may help you gain profit aside from saving on energy bills?  

North Carolina residents have access to federal solar energy programs and incentives such as net metering. Net metering allows you to sell your solar panels’ excess energy to energy providers. Such initiatives will enable you to earn extra cash as your solar energy system produces electricity.  

When you apply for these incentives, you can expect returns from your investment and the potential for passive income.  

  • Minimize Your Carbon Footprint 

One of the most important benefits of switching to solar energy is that it contributes to a lower carbon footprint. Solar is a clean and sustainable energy source, allowing you to do your part for the environment and practice an eco-friendlier lifestyle. 

Unlike traditional fossil fuels, solar panels don’t generate pollutants, carbon, and greenhouse gas emissions. This way, you can contribute to a fresher and cleaner environment and ensure ecological stability for the future. Also, unlike other common energy sources, solar power is renewable, and you’ll never run out of it.  

Wrapping Up 

With the insights above, hopefully, you can gain a better understanding of how beneficial solar panel installation can be. This clean energy solution not only helps cut back on your utility bills and improve your home value but also allows you to contribute to a better Earth. And with better access to the sun, solar panel installation is one of the best investments for North Carolina residents.

Charlotte Was Just Ranked America’s 3rd Best City For Sports Business

Charlotte just earned the distinction of being one of the top cities for sports business, according to a new report by the Sports Business Journal.

Based on an analysis of local opportunity, economic environment, and insights from industry leaders, the publication ranked the top 50 cities in the U.S. for the best opportunity and environment to conduct sports business.

The Queen City landed at #3 in the nation, beating out Minneapolis and Atlanta, and trailing only only Dallas and New York.

Charlotte’s sweeping sports media industry, thriving motorsports network, and feedback from leaders in the sports world were the biggest factors leading Charlotte’s impressive ranking.

Raleigh and Greensboro, the other North Carolina cities featured on the list, ranked 22nd and 35th, respectively.

Here’s the full ranking of the top cities for sports business:

#1 — Dallas
#2 — New York
#3 — Charlotte
#4 — Minneapolis
#5 — Atlanta
#6 — Los Angeles
#7 — Las Vegas
#8 — Nashville
#9 — Chicago
#10 — Phoenix
#11 — Indianapolis
#12 — Miami
#13 — Tampa
#14 — Cleveland
#15 — Boston
#16 — Kansas City
#17 — Cincinnati
#18 — San Diego
#19 — San Francisco
#20 — Seattle
#21 — Philadelphia
#22 — Raleigh
#23 — Austin
#24 — New Orleans
#25 — Orlando
#26 — Columbus
#27 — San Antonio
#28 — St. Louis
#29 — Houston
#30 — Pittsburgh
#31 — Denver
#32 (tie) — Detroit
#32 (tie) — Milwaukee
#34 — Washington, D.C.
#35 — Greensboro, N.C.
#36 — Memphis
#37 — Louisville, Ky.
#38 — Portland
#39 — Oklahoma City
#40 — Baltimore
#41 — Colorado Springs, Colo.
#42 — Birmingham, Ala.
#43 — Hartford, Conn.
#44 — Salt Lake City
#45 — Sacramento
#46 — Jacksonville.
#47 — Bridgeport, Conn.
#48 — Grand Rapids, Mich.
#49 — San Jose
#50 — Omaha, Neb.

Charlotte Just Witnessed Her First Snowless Winter In Recorded History

Although Charlotte is a southern city, we still experience all 4 seasons, including a decent snowfall or two each winter.

Ever since meteorological records started in Charlotte in 1878, our city has seen at least a trace dusting of snow every year during the winter months.

With winter now officially over and no recorded snowfall, the 2022-2023 winter season has just officially become the first snowless winter in Charlotte’s recorded history.

According to the National Weather Service, these are the official records for the snowfall totals in our city:

CHARLOTTE MONTHLY SNOW 1878 Present
SEASON OCT NOV DEC JAN FEB MAR APR MAY TOTAL
1878 1879 0.0 0.0 T 0.8 2.3 0.0 0.0 0.0 3.1
1879 1880 0.0 0.3 0.0 0.0 0.2 0.0 3.5 0.0 4.0
1880 1881 0.0 0.0 15.0 3.6 0.0 T 0.1 0.0 18.7
1881 1882 0.0 0.0 2.5 6.3 0.0 0.0 0.0 0.0 8.8
1882 1883 0.0 0.0 11.9 2.9 0.0 T 0.0 0.0 14.8
1883 1884 0.0 0.0 0.0 1.5 0.0 0.9 0.0 0.0 2.4
1884 1885 0.0 0.0 T 0.8 4.9 11.7 0.0 0.0 17.4
1885 1886 0.0 0.0 0.0 0.9 2.6 T 0.0 0.0 3.5
1886 1887 0.0 T 7.2 6.0 0.0 0.0 T 0.0 13.2
1887 1888 T 0.0 0.0 T T 0.0 0.0 0.0 T
1888 1889 0.0 0.0 0.0 T 8.5 0.0 0.0 0.0 8.5
1889 1890 0.0 T 0.0 0.0 T 1.0 0.0 0.0 1.0
1890 1891 0.0 0.0 2.0 0.0 T T 0.0 0.0 2.0
1891 1892 0.0 T 0.0 2.8 0.0 0.0 0.0 0.0 2.8
1892 1893 0.0 0.0 4.0 13.5 1.5 T 0.0 0.0 19.0
1893 1894 0.0 0.0 T 0.0 7.2 T 0.0 0.0 7.2
1894 1895 0.0 0.0 2.2 1.0 14.5 T T 0.0 17.7
1895 1896 0.0 0.0 0.5 0.1 1.0 0.4 0.0 0.0 2.0
1896 1897 0.0 0.0 11.0 1.1 0.0 0.0 0.0 0.0 12.1
1897 1898 0.0 0.0 0.0 1.0 T T 0.0 0.0 1.0
1898 1899 0.0 0.0 0.0 5.5 6.5 T T 0.0 12.0
1899 1900 0.0 0.0 0.0 0.8 0.1 T 0.0 0.0 0.9
1900 1901 0.0 0.0 0.0 0.0 1.0 0.0 T 0.0 1.0
1901 1902 0.0 0.0 0.0 T 17.4 0.0 0.0 0.0 17.4
1902 1903 0.0 T T 0.0 0.0 0.0 0.0 0.0 T
1903 1904 0.0 T T 1.5 1.6 0.0 0.8 0.0 3.9
1904 1905 0.0 T 3.3 T 3.2 0.0 0.0 0.0 6.5
1905 1906 0.0 0.0 3.0 0.0 0.0 T 0.0 0.0 3.0
1906 1907 0.0 1.5 T T 2.8 0.0 T 0.0 4.3
1907 1908 0.0 0.0 1.8 0.8 2.1 0.9 0.0 0.0 5.6
1908 1909 0.0 0.0 0.1 T 0.0 0.0 0.0 0.0 T
1909 1910 0.0 0.0 0.2 3.0 0.2 0.0 0.0 0.0 3.4
1910 1911 0.0 0.0 0.0 0.0 0.1 0.0 0.0 0.0 0.1
1911 1912 0.0 0.0 0.0 6.0 3.8 2.6 0.0 0.0 12.4
1912 1913 0.0 1.3 T T 0.4 0.0 0.0 0.0 1.7
1913 1914 0.0 T T 0.1 8.1 6.6 T 0.0 14.8
1914 1915 0.0 T 0.0 T 0.0 6.7 0.6 0.0 7.3
1915 1916 0.0 0.0 0.4 0.0 3.0 0.0 T 0.0 3.4
1916 1917 0.0 0.0 0.8 T 0.2 0.0 0.0 0.0 1.0
1917 1918 0.0 0.0 6.8 1.5 T 0.0 0.0 0.0 8.3
1918 1919 0.0 0.0 0.3 T 3.7 0.0 0.0 0.0 4.0
1919 1920 0.0 0.0 0.0 2.2 T T 0.0 0.0 2.2
1920 1921 0.0 0.0 0.0 4.7 2.9 0.0 0.0 0.0 7.6
1921 1922 0.0 0.0 0.0 1.8 1.2 0.0 0.0 0.0 3.0
1922 1923 0.0 0.5 0.0 0.0 0.2 0.0 0.0 0.0 0.7
1923 1924 0.0 0.0 0.0 0.0 2.4 2.3 0.0 0.0 4.7
1924 1925 0.0 0.0 0.0 1.0 0.0 T 0.0 0.0 1.0
1925 1926 0.0 0.0 0.0 2.8 T 6.7 T 0.0 9.5
1926 1927 0.0 0.0 0.0 1.8 T 13.3 0.0 0.0 15.1
1927 1928 0.0 0.0 1.3 T T T T 0.0 1.3
1928 1929 0.0 0.0 T 0.0 3.5 0.0 0.0 0.0 3.5
1929 1930 0.0 T 2.3 6.0 0.0 0.0 0.0 0.0 8.3
1930 1931 0.0 T 10.4 2.0 T 4.7 0.0 0.0 17.1
1931 1932 0.0 0.0 0.0 0.0 0.0 0.2 0.0 0.0 0.2
1932 1933 0.0 0.0 3.8 0.4 0.3 0.0 0.0 0.0 4.5
1933 1934 0.0 0.0 0.0 0.0 0.0 0.4 0.0 0.0 0.4
1934 1935 0.0 0.0 T T 0.0 0.0 0.0 0.0 T
1935 1936 0.0 T 10.5 4.7 6.7 T T 0.0 21.9
1936 1937 0.0 T T 0.0 5.1 T 0.0 0.0 5.1
1937 1938 0.0 0.0 T T T 0 T 0.0 T
1938 1939 0.0 T T 0.2 0 1.4 0.0 0.0 1.6
1939 1940 0.0 0.0 T 7.8 T 2.8 0.0 0.0 10.6
1940 1941 0.0 0.0 0.0 0 2.8 1.3 0.0 0.0 4.1
1941 1942 0.0 0.0 0.0 1.4 8.1 2.9 0.0 0.0 12.4
1942 1943 0.0 0.0 0.6 T T 0.2 0.0 0.0 0.8
1943 1944 0.0 0.0 0.7 1.8 0.3 0.0 T 0.0 2.8
1944 1945 0.0 0.0 T 0 T 0.0 0.0 0.0 T
1945 1946 0.0 0.0 5.4 0.6 0.0 0.0 0.0 0.0 6.0
1946 1947 0.0 0.0 0.0 0.0 T 1.3 0.0 0.0 1.3
1947 1948 0.0 0.0 5.8 0.4 7.1 0.0 0.0 0.0 13.3
1948 1949 0.0 0.0 T 0.6 0.0 0.0 0.0 0.0 0.6
1949 1950 0.0 0.0 0.1 T 0.0 0.0 0.0 0.0 0.1
1950 1951 0.0 T T 0.0 0.2 T T 0.0 0.2
1951 1952 0.0 T 0.1 T 4.0 T 0.0 0.0 4.1
1952 1953 0.0 T T T T T 0.0 0.0 T
1953 1954 0.0 0.0 T 3.5 0.0 T T 0.0 3.5
1954 1955 0.0 T T 8.6 T 0.1 0.0 0.0 8.7
1955 1956 0.0 T T 0.5 T T 0.0 0.0 0.5
1956 1957 0.0 T 0 T T 0.0 0.0 0.0 T
1957 1958 0.0 0.0 T 1.0 2.2 0.0 0.0 0.0 3.2
1958 1959 0.0 0.0 3.0 T T 1.3 0.0 0.0 4.3
1959 1960 0.0 0.0 T 0.0 3.3 19.3 0.0 0.0 22.6
1960 1961 0.0 0.0 0.3 1.2 0.8 T 0.0 0.0 2.3
1961 1962 0.0 0.0 T 11.7 T T 1.4 0.0 13.1
1962 1963 0.0 T T T 2.5 0.0 0.0 0.0 2.5
1963 1964 0.0 T 1.1 0.6 0.2 T 0.0 0.0 1.9
1964 1965 0.0 T 0.0 11.2 1.0 T 0.0 0.0 12.2
1965 1966 0.0 0.0 0.0 9.6 1.1 0.0 0.0 0.0 10.7
1966 1967 0.0 0.0 T T 5.4 0.0 0.0 0.0 5.4
1967 1968 0.0 0.0 T 4.3 2.4 T 0.0 0.0 6.7
1968 1969 0.0 2.5 T T 13.2 3.0 0.0 0.0 18.7
1969 1970 0.0 0.0 T 4.5 T 0.0 0.0 0.0 4.5
1970 1971 0.0 0.0 2.7 0.1 0.8 5.7 0.0 0.0 9.3
1971 1972 0.0 T 7.5 0.0 0.5 3.7 0.0 0.0 11.7
1972 1973 0.0 T 0.0 5.5 1.0 0.0 0.0 0.0 6.5
1973 1974 0.0 0.0 5.4 0.0 T 1.4 0.0 0.0 6.8
1974 1975 0.0 0.0 T 0.0 1.0 0.2 0.0 0.0 1.2
1975 1976 0.0 0.5 T T T 0.0 0.0 0.0 0.5
1976 1977 0.0 T T 3.4 T 0.0 0.0 0.0 3.4
1977 1978 0.0 0.0 T T 0.7 4.8 0.0 0.0 5.5
1978 1979 0.0 0.0 0.0 0.4 14.9 0.0 0.0 0.0 15.3
1979 1980 0.0 0.0 0.0 0.4 7.3 6.8 0.0 0.0 14.5
1980 1981 0.0 0.0 0.3 1.8 T T 0.0 0.0 2.1
1981 1982 0.0 0.0 T 4.8 5.9 0.0 0.1 0.0 10.8
1982 1983 0.0 0.0 T 0.8 1.5 10.3 0.0 0.0 12.6
1983 1984 0.0 T T T 5.9 0.0 0.0 0.0 5.9
1984 1985 0.0 0.0 T 1.7 T 0.0 0.0 0.0 1.7
1985 1986 0.0 0.0 T T 0.3 T 0.0 0.0 0.3
1986 1987 0.0 0.0 0.0 5.6 2.1 0.3 T 0.0 8.0
1987 1988 0.0 T 0.0 12.1 0.0 0.0 0.0 0.0 12.1
1988 1989 0.0 0.0 T 0.0 3.5 T 0.0 0.0 3.5
1989 1990 0.0 T 0.6 0.0 0.0 T 0.0 0.0 0.6
1990 1991 0.0 0.0 T 1.0 T T 0.0 0.0 1.0
1991 1992 0.0 T T 0.0 0.0 0.0 0.0 T
1992 1993 0.0 0.0 T 0.0 T 1.6 0.0 0.0 1.6
1993 1994 0.0 0.0 2.6 T T 0.0 0.0 0.0 2.6
1994 1995 0.0 0.0 T T T 0.0 0.0 0.0 T
1995 1996 0.0 0.0 0.0 3.0 T T 0.0 0.0 3.0
1996 1997 0.0 0.0 T 0.1 0.4 0.0 0.0 0.0 0.5
1997 1998 0.0 0.0 2.9 1.5 0.0 0.5 0.0 0.0 4.9
1998 1999 0.0 0.0 T T 1.4 0.5 0.0 0.0 1.9
1999 2000 0.0 0.0 T 9.2 0.0 0.0 0.0 0.0 9.2
2000 2001 0.0 2.5 0.2 T 0.0 T 0.0 0.0 2.7
2001 2002 0.0 0.0 0.0 4.4 0.0 0.0 0.0 0.0 4.4
2002 2003 0.0 0.0 T 9.5 0.6 0.0 0.0 0.0 10.1
2003 2004 0.0 0.0 T 1.3 13.2 0.0 0.0 0.0 14.5
2004 2005 0.0 0.0 0.0 0.8 0.0 T 0.0 0.0 0.8
2005 2006 0.0 0.0 T 0.0 T T 0.0 0.0 T
2006 2007 0.0 T 0 T 1.0 0.0 0.0 0.0 1.0
2007 2008 0.0 0.0 T 1.4 0.0 0.0 0.0 0.0 1.4
2008 2009 0.0 0.0 0.0 T T 4.0 0.0 0.0 4.0
2009 2010 0.0 0.0 T 2.7 2.8 0.4 0.0 0.0 5.9
2010 2011 0.0 0.0 2.0 4.1 T 0.0 0.0 0.0 6.1
2011 2012 0.0 0.0 0.0 0.0 T 0.0 0.0 0.0 T
2012 2013 0.0 0.0 0.0 T 2.7 T 0.0 0.0 2.7
2013 2014 0.0 T 0.0 0.9 8.4 T 0.0 0.0 9.3
2014 2015 0.0 0.0 0.0 0.0 3.1 0.0 0.0 0.0 3.1
2015 2016 0.0 0.0 0.0 3.3 T 0.0 0.0 0.0 3.3
2016 2017 0.0 0.0 T 1.1 0.0 1.1 0.0 0.0 2.2
2017 2018 0.0 0.0 0.1 3.9 0.0 0.2 T 0.0 4.2
2018 2019 0.0 T 2.9 T T T 0.1 0.0 3.0
2019 2020 0.0 0.0 0.0 T 0.3 0.0 0.0 0.0 0.3
2020 2021 0.0 0.0 0.0 0.1 0.2 0.0 0.0 0.0 0.3
2021 2022 0.0 0.0 T 4.3 0.0 0.0 0.0 0.0 4.3
2022 2023 0.0 0.0 0.0 0.0 0.0 0.0 0.0
TOTAL T 9.1 145.6 247.6 253.3 133.5 6.6 0.0 795.6
NORMAL 0.0 0.1 0.3 2.1 1.2 0.6 0.0 0.0 4.3


There is still hope of seeing some snowfall this Spring, as it’s not overly uncommon for Charlotte to get one last cold snap before the eternal heatwaves of summer arrive.

Governor Cooper Unveils Plan To Invest $1 Billion in North Carolina’s Mental Health Crisis

Governor Roy Cooper has unveiled a plan to invest $1 billion in order to address North Carolina’s mental health and substance abuse crisis. This crisis has been marked by a sharp rise in anxiety and depression, an increase in overdose deaths by 72 percent, and a doubling of youth suicide rates.

The plan outlines investments in the continuum of behavioral health care, including making behavioral health services more accessible, building support systems for those in crisis and those with complex needs, and using data and technology to improve health access and outcomes. This plan also includes initiatives to support the behavioral health workforce, which is essential for its success.

“Our mental health system is under significant stress and in need of major investments to make sure every family, student and North Carolinian can get critical care,” Governor Cooper said in a press release. “This plan tackles the ongoing mental health crisis in a direct and meaningful way by investing in the whole-person health of North Carolinians. It will empower workplaces, schools, and local governments in search of more ways to help their communities and most importantly, it will save lives.”

The full break down of the $1 billion investment includes:

  • Increase Medicaid reimbursement rates for behavioral health services ($225 million)
  • Improve routine access to integrated care in communities and schools ($175 million)
  • Created new links between behavioral health and justice systems ($150 million)
  • Strengthen statewide behavioral health crisis system ($200 million)
  • Transform child welfare and family well-being ($100 million)
  • Create sustainable hospitalization and step-down options ($100 million)
  • Enable better health access and outcomes with data and technology ($50 million)

You can check out the full plan online here.