

Charlotte Saw 9.8% Increase in Retail Businesses – 5th Highest in US

0

The recent new tariffs—including a 145% duty on Chinese imports—have already pushed retailers like Shein and Temu to raise prices, while major chains like Walmart, Target, and Home Depot are warning of looming supply shortages and higher costs for American shoppers. As retail businesses brace for disruption, many of the fastest-growing areas for brick-and-mortar stores may also be the most vulnerable.

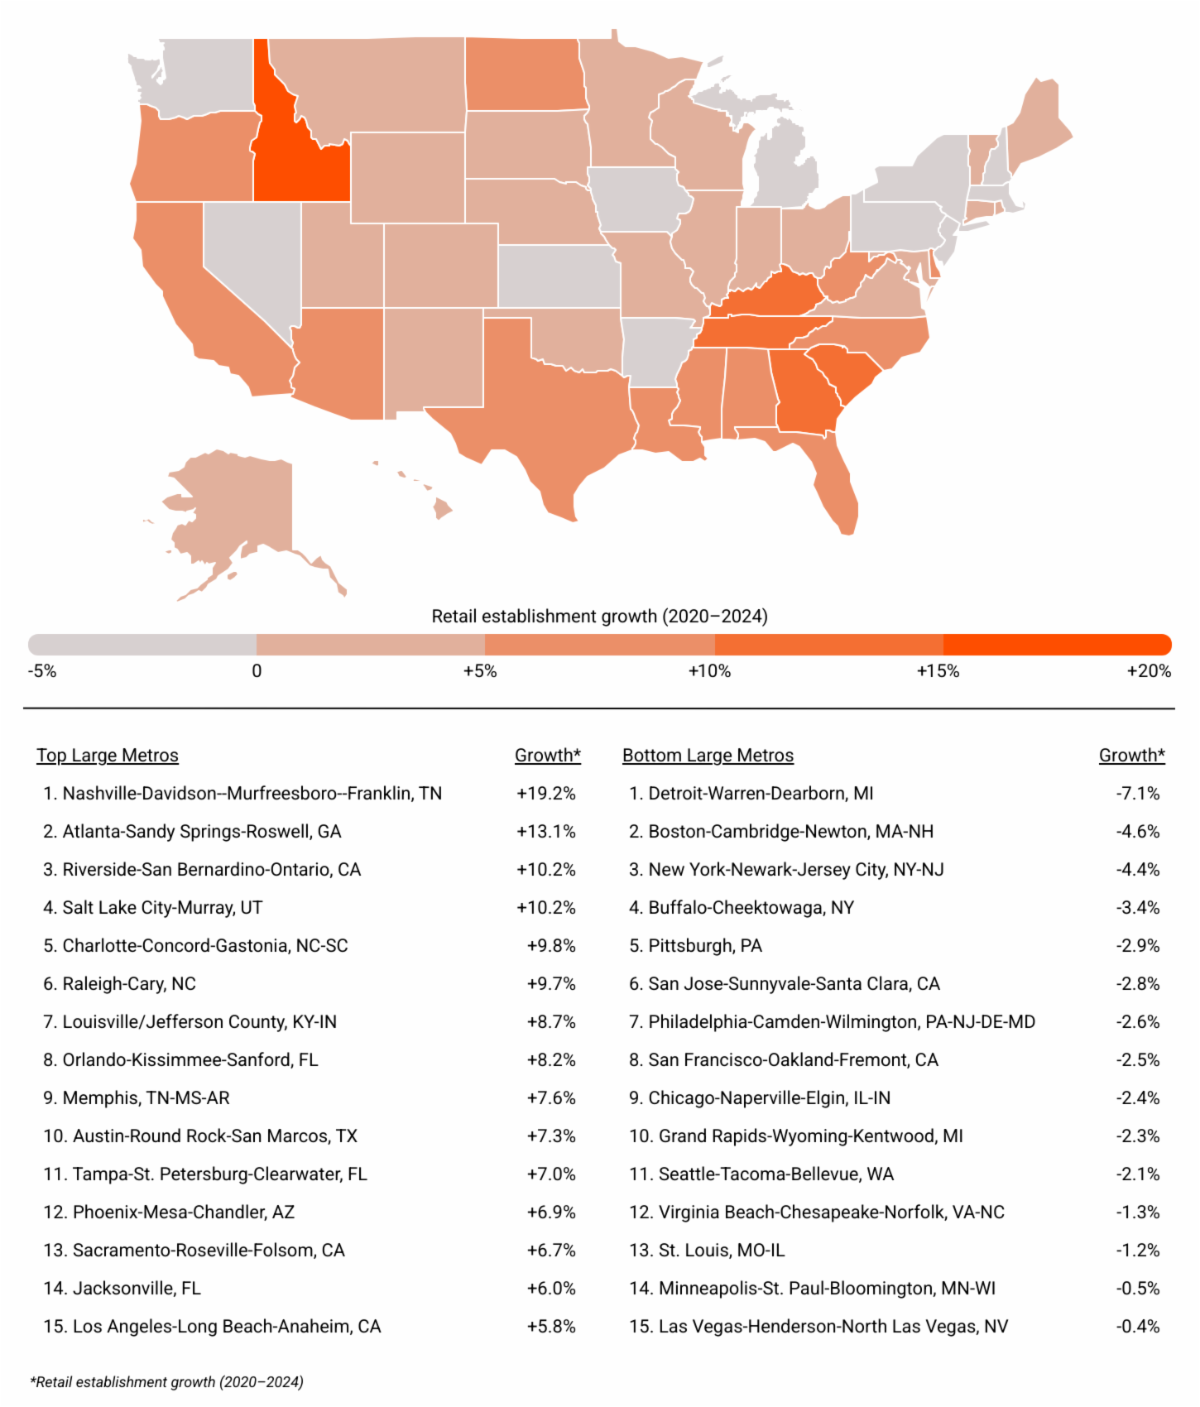
A recent analysis from Printastic spotlights the U.S. cities and states where physical retail is growing (and shrinking) fastest, and which locations could face new headwinds just as in-person shopping was beginning to recover.

Key Takeaways, With Data for Charlotte-Concord-Gastonia, NC-SC

  • Retail’s Long Decline—and Fragile Recovery: Over the past 20 years, retail establishment growth (+4.8%) has lagged far behind total U.S. business growth (+49.4%), with major setbacks during the Great Recession and COVID-19 pandemic.
  • Post-Pandemic Gains Face New Threats: From 2020 to 2024, the sector added over 38,000 new stores and 870,000 jobs—the strongest retail expansion in decades—raising the stakes as new tariffs take hold.
  • Southeastern and Western States Lead in Retail Growth: States like Idaho (+18.8%), Tennessee (+14.5%), and Georgia (+12.5%) posted the highest retail growth since 2020, while parts of the Northeast and Midwest posted declines.
  • Metro-Level Growth Could Stall: In the metros where retail has grown between 2020 and 2024, rising costs could test the durability of those gains—while metros reporting losses may face rising vacancies and an even slower path to recovery if tariffs weaken consumer demand.
  • How Retail Has Fared in the Charlotte metro: Between 2020 and 2024, the Charlotte metro gained 793 retail establishments—an increase of 9.8%, the 5th highest of any large metro. Meanwhile, retail employment increased by 12,833 workers (+10.5%) during that span.

The Hot Wheels Legends Tour Rolls into Charlotte in Search of the Next Hot Wheels Die-Cast

0

On May 17, the Hot Wheels Legends Tour, the world’s largest traveling car show and  global contest offering custom car builders the unique opportunity to have their passion projects turned into the next Hot Wheels die-cast toy car, rolls into the Charlotte area.

At this free, family friendly event, Hot Wheels designers and local celebrity judges will examine each vehicle based on three key categories: authenticity, creativity, and garage spirit. The winner of the event will move on to the national semi-final later this year for a chance to represent the U.S. in the Global finale.

The judges are seeking extreme, on-trend, and relevant vehicles while also considering overall creativity. Extra points are awarded when late-nights, early mornings, grit, and determination are evident in the build.

In addition to more than 100 unique vehicles, the Charlotte Hot Wheels Legends Tour event will include activities for fans of all ages, including the Hot Wheels Garage of Legends life-size cars, play spaces where kids can interact with the latest Hot Wheels toys, and Hot Wheels die-cast displays featuring coveted premium and collector cars. Additionally, Hot Wheels enthusiasts can find special edition Hot Wheels Legends products only available on tour.

Charlotte-Based Fintech Firm AvidXchange Is Being Sold for $2.2 Billion

0

Charlotte-based fintech company AvidXchange is being acquired for $2.2 billion in an all-cash deal by private equity firm TPG and global payments company Corpay, according to a company announcement this morning.

The transaction, valued at $10 per share, represents a 22% premium over AvidXchange’s May 6 closing price of $8.20 and a 45% premium over its March 12 closing price, the day before reports of a potential sale emerged. Once the deal closes, AvidXchange will become a private company

TPG, based in San Francisco, will take a majority stake through its U.S. and European private equity platform. Atlanta-based Corpay will hold a minority interest in the company.

“We are pleased to have reached an agreement that delivers significant value for AvidXchange stockholders and positions our business for long-term growth and success for our valued customers,” said AvidXchange CEO Michael Praeger in a press release. “Over the last 25 years, AvidXchange has established itself as a leader in AP automation and payment software by building a differentiated platform primed for growth. With TPG and Corpay, we will have the resources and long-term focus to scale our platform and provide more innovative solutions that help our customers across the country transform their accounts payable processes.”

Founded in 2000 by CEO Michael Praeger and co-founder David Miller in a Charlotte coffee shop, AvidXchange grew into a major fintech player, going public in 2021 and employing 1,600 people nationwide—with nearly 1,200 based in Charlotte.

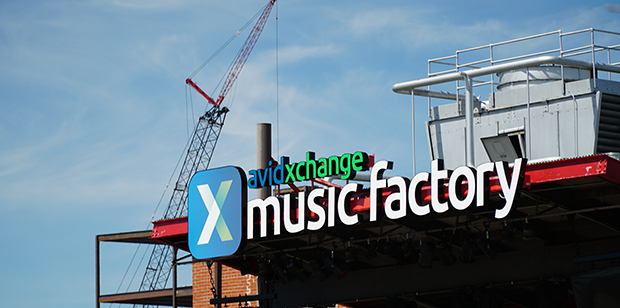
In 2017, AvidXchange moved into its headquarters at the Music Factory, and secured naming rights to the venue.

The sale is expected to close in the fourth quarter of 2025, pending shareholder and regulatory approvals. No financing conditions are attached to the deal.

Griffin Concedes NC Supreme Court Race After Judge Upholds Ballots

0

Republican Jefferson Griffin conceded to Democratic Justice Allison Riggs on Wednesday, ending a legal battle over thousands of challenged ballots in the North Carolina Supreme Court race.

Griffin’s concession followed U.S. District Judge Richard Myers’ ruling upholding the ballots and ordering certification of Riggs’ 734-vote victory out of over 5.5 million cast.

Griffin, whose term on the Court of Appeals ends in 2028, said he would not appeal in a public statement.

Myers found that removing ballots, initially challenged in six Democratic-leaning counties, would violate voters’ constitutional rights.

Riggs’ win secures an eight-year term and boosts Democrats’ chances of regaining the state Supreme Court majority.

Data Study: It Takes 14.5 Years to Save for Charlotte Down Payment

0

For much of the past decade, a 20% down payment was enough to make homeownership feasible in most U.S. cities—typically requiring around six years of saving. That standard no longer holds: as mortgage rates and home prices have surged, the gap between what buyers can afford and what homes cost has widened dramatically.
While these housing affordability challenges exist nationwide, some areas give potential buyers shorter savings timelines than others. A new analysis from Upgraded Points examines how long it would take the typical household to save for a home in cities across the U.S., based on current home prices, mortgage rates, incomes, and other housing-related costs.

Key Takeaways, With Data for Charlotte, NC

  • 41% Down Is the New 20%: In 2025, the typical U.S. household would need a 41% down payment—about $148,000—and nearly 13 years of saving to afford the median-priced home.
  • Few Cities Remain Affordable: In just 4 of America’s 54 largest cities could a buyer afford the monthly payments with 20% down or less.
  • Borrowing Power for Charlotte Homebuyers: Earning the city’s median income of $83,204, the typical household in Charlotte can afford to borrow $222,388 of the $398,872 median home price. This leaves a required down payment of about $176K (44.2% of the purchase price).
  • Charlotte Buyers Need 14.5 Years to Save: Assuming buyers spend no more than 30% of their income on housing, invest 10% of their gross income, and earn a 5% annual return, it would take the typical Charlotte household 14.5 years to save the required down payment.

How Long Does It Take To Save for a Home in Every U.S. City?

1 Los Angeles, CA 35.1 $814,336 82.6% $986,145 $171,809 $85,249 $2,131 $1,124 $1,008
2 Miami, FL 31.6 $483,530 81.7% $591,524 $107,994 $62,998 $1,575 $706 $869
3 San Jose, CA 31.2 $1,123,731 73.4% $1,531,233 $407,502 $150,166 $3,754 $2,665 $1,089
4 New York, NY 31.0 $624,228 81.3% $767,759 $143,531 $84,556 $2,114 $939 $1,175
5 Long Beach, CA 30.3 $629,753 73.2% $860,458 $230,705 $89,071 $2,227 $1,509 $718
6 San Diego, CA 29.4 $736,318 71.6% $1,028,632 $292,314 $110,659 $2,766 $1,912 $855
7 San Francisco, CA 27.5 $882,233 67.7% $1,302,230 $419,997 $150,040 $3,751 $2,746 $1,005
8 Boston, MA 26.1 $537,400 70.9% $757,504 $220,104 $100,512 $2,513 $1,439 $1,073
9 Oakland, CA 25.2 $520,521 68.8% $756,579 $236,058 $103,285 $2,582 $1,544 $1,038
10 Seattle, WA 23.5 $576,430 64.8% $888,951 $312,522 $129,396 $3,235 $2,044 $1,191
11 Portland, OR 20.1 $324,817 60.0% $541,664 $216,848 $94,187 $2,355 $1,418 $937
12 Austin, TX 19.6 $320,833 60.9% $526,444 $205,611 $97,018 $2,425 $1,345 $1,081
13 Tucson, AZ 19.5 $189,928 57.5% $330,025 $140,096 $57,860 $1,447 $916 $530
14 Las Vegas, NV 18.7 $230,908 53.5% $431,579 $200,671 $75,020 $1,876 $1,312 $563
15 Denver, CO 18.5 $296,079 52.7% $561,628 $265,549 $97,251 $2,431 $1,736 $695
16 Fresno, CA 18.5 $215,478 55.6% $387,604 $172,125 $70,863 $1,772 $1,126 $646
17 Sacramento, CA 17.9 $256,281 52.6% $487,408 $231,127 $88,842 $2,221 $1,511 $710
18 Nashville-Davidson, TN 17.8 $228,284 52.3% $436,392 $208,109 $79,766 $1,994 $1,361 $633
19 Washington, DC 17.5 $315,701 51.9% $607,877 $292,176 $112,745 $2,819 $1,911 $908
20 Aurora, CO 17.4 $247,583 50.7% $488,471 $240,888 $89,443 $2,236 $1,575 $661
21 Mesa, AZ 16.2 $207,772 47.1% $440,951 $233,179 $83,566 $2,089 $1,525 $564
22 Tampa, FL 16.2 $187,776 49.4% $380,089 $192,313 $75,634 $1,891 $1,258 $633
23 Raleigh, NC 16.1 $214,790 48.7% $441,338 $226,548 $87,432 $2,186 $1,481 $704
24 Colorado Springs, CO 15.9 $214,635 46.8% $458,759 $244,124 $88,253 $2,206 $1,596 $610
25 Phoenix, AZ 15.7 $193,750 46.3% $418,907 $225,157 $81,722 $2,043 $1,472 $571
26 Bakersfield, CA 15.4 $189,131 47.9% $394,482 $205,351 $82,100 $2,052 $1,343 $710
27 Albuquerque, NM 15.1 $156,223 46.5% $336,297 $180,074 $69,590 $1,740 $1,178 $562
28 Atlanta, GA 14.8 $189,739 48.2% $393,553 $203,814 $86,916 $2,173 $1,333 $840
29 Dallas, TX 14.7 $156,278 50.1% $312,165 $155,888 $71,877 $1,797 $1,019 $778
30 Charlotte, NC 14.5 $176,484 44.2% $398,872 $222,388 $83,204 $2,080 $1,454 $626
31 New Orleans, LA 14.3 $122,504 51.5% $238,078 $115,574 $58,701 $1,468 $756 $712
32 Arlington, TX 13.3 $147,628 46.7% $315,840 $168,212 $77,986 $1,950 $1,100 $850
33 Milwaukee, WI 13.2 $102,472 49.4% $207,457 $104,985 $55,041 $1,376 $687 $689
34 Houston, TX 12.8 $119,615 44.5% $268,584 $148,969 $66,715 $1,668 $974 $694
35 Chicago, IL 12.2 $134,212 44.3% $302,972 $168,760 $79,699 $1,992 $1,104 $889
36 Virginia Beach, VA 11.9 $156,037 38.2% $408,787 $252,750 $96,195 $2,405 $1,653 $752
37 Minneapolis, MN 11.4 $130,248 40.0% $325,347 $195,099 $85,146 $2,129 $1,276 $853
38 Jacksonville, FL 11.1 $105,145 36.3% $289,992 $184,847 $71,051 $1,776 $1,209 $568
39 Omaha, NE 10.9 $110,942 39.2% $283,327 $172,385 $77,126 $1,928 $1,127 $801
40 San Antonio, TX 10.7 $94,615 37.4% $253,248 $158,633 $66,740 $1,668 $1,037 $631
41 Fort Worth, TX 10.5 $112,523 37.2% $302,646 $190,123 $81,256 $2,031 $1,243 $788
42 El Paso, TX 9.8 $78,152 34.5% $226,634 $148,483 $62,303 $1,558 $971 $587
43 Columbus, OH 9.4 $82,681 33.6% $245,897 $163,216 $69,296 $1,732 $1,067 $665
44 Louisville/Jefferson County, KY 9.0 $77,733 31.3% $248,427 $170,694 $68,664 $1,717 $1,116 $600
45 Philadelphia, PA 8.3 $66,507 29.7% $224,090 $157,583 $64,386 $1,610 $1,030 $579
46 Tulsa, OK 7.9 $59,790 29.2% $204,676 $144,886 $61,956 $1,549 $947 $601
47 Kansas City, MO 7.7 $66,690 27.7% $240,944 $174,255 $71,547 $1,789 $1,139 $649
48 Indianapolis, IN 7.2 $58,222 25.7% $226,904 $168,682 $66,822 $1,671 $1,103 $568
49 Baltimore, MD 6.6 $49,068 26.3% $186,557 $137,489 $63,246 $1,581 $899 $682
50 Cleveland, OH 6.0 $28,745 25.4% $113,044 $84,299 $41,568 $1,039 $551 $488
51 Wichita, KS 5.2 $39,517 20.0% $197,584 $162,993 $66,904 $1,673 $1,066 $607
52 Oklahoma City, OK 5.0 $40,393 20.0% $201,963 $173,821 $70,755 $1,769 $1,137 $632
53 Memphis, TN 4.8 $29,268 20.0% $146,339 $121,867 $54,323 $1,358 $797 $561
54 Detroit, MI 3.4 $15,379 20.0% $76,894 $77,275 $41,980 $1,049 $505 $544

I-485 Toll Lanes Near Completion in South Charlotte After Years of Delays

0

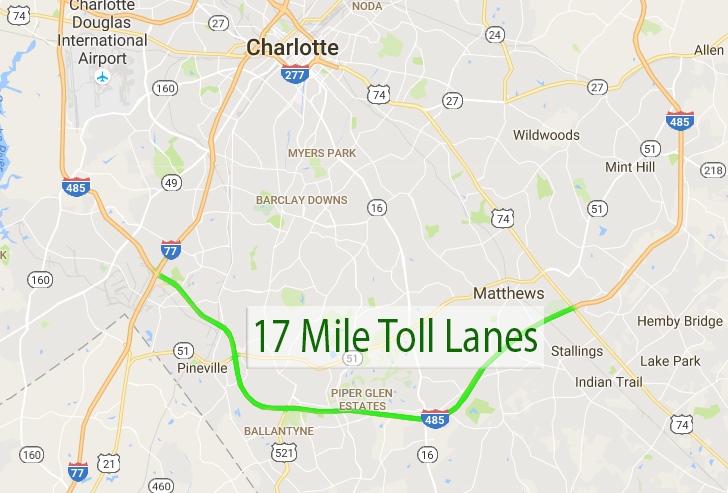
South Charlotte drivers can expect to use the long-awaited I-485 toll lanes this winter, nearly five years after construction began.
The $346 million project, which started in 2019, adds express lanes and general-purpose lanes aimed at reducing traffic and improving travel times.

The I-485 lanes stem from the 2007 Fast Lane Study, which identified highways most in need of congestion relief.

Once complete, the project will feature one express lane in each direction between I-77 and Independence Boulevard, plus a new general-purpose lane between Rea Road and Providence Road in the Ballantyne and Waverly/Rea Farms areas.

Drivers will also gain direct access to the express lanes from new interchanges at Westinghouse Boulevard and Johnston Road.

Additional improvements include:

  • Ballantyne Commons bridge widening, set for completion by mid-spring

  • Weddington Road widening, expected by late summer or early fall

  • John Street widening, planned for fall to improve traffic flow at nearby ramps

Originally budgeted at $289.5 million, costs have climbed due to added scope and pandemic-related delays, including labor shortages and supply chain issues.

This becomes Charlotte’s third major toll project, following the I-77 toll lanes to Lake Norman and the toll lanes on the new Monroe Expressway.

Charlotte Building The Longest Biking Trail in NC – The XCLT

0

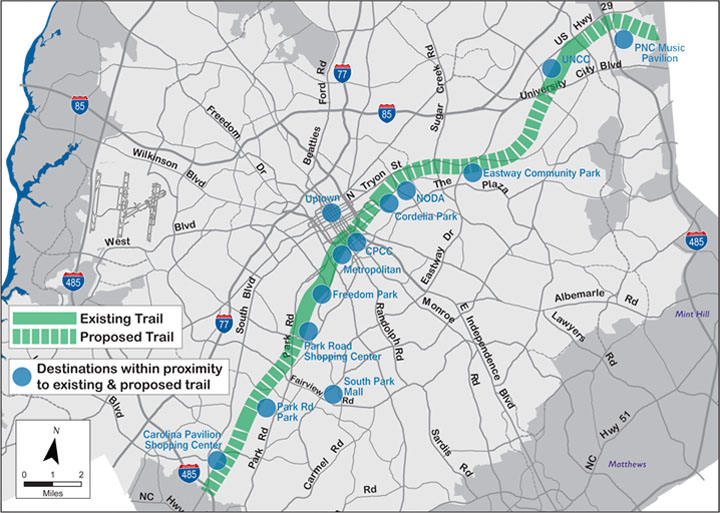
The City of Charlotte and Mecklenburg County continue to make significant progress on their 26-mile Cross Charlotte Trail (XCLT) – a trail that will soon stretch all the way from South Carolina, through Pineville and Uptown Charlotte, then up to UNCC until it hits the Cabarrus County line in Harrisburg.

Once completed, XCLT will officially be the longest paved biking trail in North Carolina – you’ll be able to ride seamlessly from one end of Mecklenburg County to the other. The longest current trail is the American Tobacco Trail extending 22 miles from Durham to down to Wake County.

Cross Charlotte Trail map

REAL ID Enforcement Begins May 7: What North and South Carolina Residents Need to Know

0

Starting May 7, 2025, federal agencies will begin fully enforcing the REAL ID Act, requiring compliant identification to board commercial flights and enter secure federal facilities. Travelers and visitors without a REAL ID, U.S. passport, or other federally approved ID may be denied access or required to show additional documents.


In both North Carolina and South Carolina, residents can now choose between a REAL ID-compliant license or ID and a standard version marked “Not for Federal Purposes” or “Not for Federal Identification.”

What Is a REAL ID?

A REAL ID is a standard driver’s license or identification card that includes a gold or white star at the top. Cards without this star do not meet federal identification standards.

In North Carolina, the REAL ID functions exactly like a traditional license but includes the star to indicate federal compliance.

What Can You Still Do Without a REAL ID?

A REAL ID is not required for several everyday tasks. Residents without a REAL ID may still:

  • Drive legally

  • Vote in elections

  • Apply for or receive federal benefits

  • Access hospitals or emergency services

  • Enter post offices or federal buildings that don’t require ID

  • Participate in legal proceedings, such as federal court testimony or jury duty

However, beginning May 7, those without a REAL ID will need additional documents to:

  • Board commercial flights

  • Enter secure federal buildings

  • Visit military bases, nuclear sites, or federal prisons

How to Get a REAL ID in North Carolina

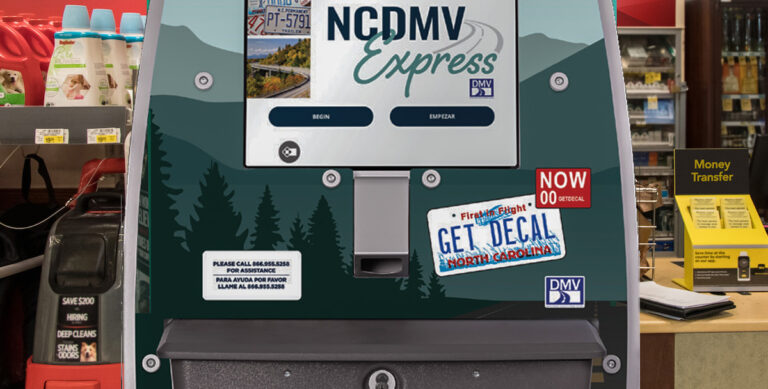
To obtain a North Carolina REAL ID, residents must visit an NC DMV kiosk or office and bring:

  • One proof of identity (e.g., U.S. birth certificate or valid passport)

  • One document with a Social Security number

  • Two documents proving current NC address

  • Proof of any legal name changes, if applicable

South Carolina REAL ID Details

South Carolina follows a similar process. Since 2017, residents have been able to choose between a REAL ID (with a gold star) and a standard license.

To get a South Carolina REAL ID, residents must provide the following at the SCDMV:

  • Proof of identity (birth certificate or valid U.S. passport)

  • Verified Social Security number

  • Two proofs of current physical SC address

  • Proof of all legal name changes, if applicable

The only added requirement for REAL ID over a standard ID in South Carolina is the second proof of address.

Plan Ahead Before May 7, 2025

Both states urge residents who plan to travel or enter federal buildings to apply early. REAL ID cards are optional—but skipping them may mean longer lines, more paperwork, or denied access.

For more information, visit www.ncdot.gov/dmv or www.scdmvonline.com.

North Carolina Is Among The Top States in America Adding The Least Amount of Mortgage Debt

0

Americans collectively owe over $12.6 trillion in mortgage debt, and the personal finance website WalletHub today released its report on the States Adding the Most Mortgage Debt, highlighting where homeowners are facing the greatest challenges.

The site examined proprietary data from Q3 2024 to Q4 2024 to compare mortgage debt trends across all 50 states.

North Carolina ranked 43rd in the nation and South Carolina ranked 31st.

States Adding the Most Mortgage Debt

Overall Rank*  State Total Score  Change in Mortgage Debt Q4 2024 vs Q3 2024 Rank  Average Mortgage Balance Q4 2024 & Monthly Payment Q4 2024 Rank 
1 Vermont 78.93 1 30
2 Delaware 59.20 2 32
3 Massachusetts 59.11 6 5
4 Minnesota 51.49 4 21
5 Hawaii 51.18 17 2
6 Arkansas 49.62 3 45
7 California 47.05 31 1
8 Maine 46.79 5 34
9 Washington 45.31 21 4
10 Colorado 44.39 16 7
11 Nevada 44.10 12 12
12 New Hampshire 43.50 10 17
13 Virginia 41.93 15 11
14 Florida 41.64 14 13
15 New Mexico 39.32 7 42
16 New York 38.71 33 3
17 Texas 38.55 18 14
18 Tennessee 38.53 9 31
19 North Dakota 38.03 8 36
20 Oregon 37.85 20 15
21 Alabama 35.19 11 41
22 Georgia 35.15 24 19
23 Alaska 33.97 26 16
24 New Jersey 33.50 38 6
25 Oklahoma 33.03 19 25
26 Arizona 32.77 28 18
27 Wisconsin 30.96 13 44
28 Maryland 29.10 43 9
29 Missouri 28.37 22 39
30 Rhode Island 26.53 29 28
31 South Carolina 26.17 30 29
32 Wyoming 25.21 37 22
33 Ohio 24.79 23 47
34 Louisiana 23.93 35 33
35 Illinois 23.56 40 23
36 Idaho 23.56 36 26
37 Utah 22.38 46 10
38 Kentucky 22.28 25 49
39 Mississippi 21.76 27 48
40 Connecticut 20.87 49 8
41 Indiana 20.68 34 43
42 Iowa 19.55 32 46
43 North Carolina 19.03 44 27
44 Michigan 18.32 39 40
45 Pennsylvania 17.79 41 37
46 Montana 17.39 47 20
47 South Dakota 15.49 48 24
48 Nebraska 14.96 45 35
49 West Virginia 11.20 42 50
50 Kansas 6.30 50 38

Note: *No. 1 = Largest Mortgage Debt Increase

How Live In-Play Betting Is Reshaping How Fans Watch Sports

0

The sports betting landscape has dramatically changed in recent years, with in-play markets emerging as the industry’s most thrilling and profitable innovations. This revolution represents more than new betting markets – it’s transforming how fans watch sports and how sportsbooks approach their business.

Unlike pre-match betting, where bettors make predictions based on historical results, live betting thrives on making in-the-moment decisions based on what’s happening in the game. This approach gives sports fans a unique thrill and gives sportsbooks an engaging revenue stream. Here’s why live betting has become a game-changer in how people interact with sports.

Why sports fans love in-play betting over pre-match strategies

Live betting has transformed match-viewing experiences for different sports. Instead of passively consuming the gameplay, games deliver more interactive experiences where each development presents new analytical experiences. Here are three reasons why sports punters enjoy live betting markets while watching their favorite matches.

A more thrilling experience

Placing live bets on Betway brings your knowledge of the gameplay to a much higher focus. Sports fans with a better understanding of the game’s momentum can make better predictions about where it’s headed. That means avid sports fans can use this information to make significant amounts, bringing the entertainment factor to the next level since you place bets as the action unfolds.

Access to better game data

Before placing a pre-match bet online at Betway, it’s important to research and gather helpful data to make more calculated decisions. In a way, in-play betting is similar to pre-game betting with one exception—the data required to make decisions comes from what you’re watching. That’s an advantage for the punters, as it can be hard to look at the teams on paper and accurately predict how the action will play out.

Boosts a game’s social interaction

Live betting boosts a game’s social aspect. Players can share information about the game with their friends when betting on the action, adding a community aspect to the betting experience.

How is live betting changing sports viewership?

Live betting = active participation

Instead of sitting back and passively watching the game, fans can actively engage with the gameplay. Live betting makes every detail of the match an opportunity to place bets with different markets, whether it’s the corner kick or goal scorer markets. That boosts the level of engagement, turning match viewers into participants.

Attention to detail

Live betting encourages sports fans to pay attention to every second of the game. That’s because any changes to the match can significantly alter the direction of the match and the odds-on different outcomes. That deepens the fans’ appreciation of game nuances and makes them more invested in their favorite games.

Driving live viewership

Since in-play betting depends on real-time gameplay, the fans are highly likely to watch the action as it happens. League, sportsbooks, and broadcasters all benefit from the boost in viewership and engagement by increasing their revenue streams as fans can continuously place bets as events unfold.