
A Higher Purpose: How Soft2Bet Is Using Success to Serve Those In Need

0

Profits and satisfied shareholders way too often measure corporate success. It’s rare to see a narrative that places compassion, community and service at the heart of its mission. Thankfully, the rising leader in the iGaming industry, Soft2Bet, has spent the last eight years expanding its reach and building a legacy of charitable giving. Through charitable arms like the Soft2Bet Fund, Innovation Fund, and Yael Foundation, Soft2Bet is channeling its resources into causes that matter, proving that success is not just about money. For CEO Uri Poliavich, it’s about using growth, innovation and business advancement for a higher purpose: helping those in need and inspiring others to do the same.

Where It All Began

Soft2Bet, founded just over eight years ago, began as an ambitious startup from a humble office. Now, that small, ambitious team of self-starters, led by Uri Poliavich, has evolved into a globally recognized iGaming giant with over 16 licenses and 10 successful brands. Soft2Bet offers cutting-edge gaming platforms, either turnkey or as integrative building blocks. With innovation as the company’s core value, Soft2Bet has left its footprint across many regulated European markets, such as Sweden, Finland and Denmark. But what sets Soft2Bet apart from its competitors is its belief that with great business success comes great responsibility to take care of those in need, just as Uri said: “And that mindset applies not only to the job—but also to the charity. The charity fuels our purpose, inspiring us to grow the business and expand its impact. It pushes us to think bigger, act bolder, and build something that truly matters”.

As Soft2Bet continued its growth, the leadership remained grounded in the idea that business success isn’t significant until it has been used to create positive change. This thinking is precisely the mindset that laid the ground for the charitable foundations we will talk about today. Rather than viewing charity as a side effort, CEO and founder Uri has integrated it into companies corporate culture – all employees support and actively participate in charitable activities presented to them. Soft2bets leadership has repeatedly emphasized that a business’s true strength lies not only in financial achievements but also in its ability to change people’s lives. This same value-driven approach is what continues to drive Soft2Bet’s mission today.

Supporting Emerging iGaming Businesses

Soft2Bet is adamant about supporting people in underserved communities, emerging businesses, and entrepreneurs. That’s precisely why it launched Soft2Bet Invest – a €50 million iGaming Innovation Fund to help emerging players in the iGaming industry. With investment running from €500,000 to €1 million per project, the fund wants to target both growth-stage and established companies promoting innovative gaming technology growth. Uri recently commented: “In our business, we’re always on the lookout for bright ideas—for new people with bold, innovative suggestions. We’re constantly striving to improve, to evolve, and to challenge the norm. We approach things from different angles to reshape the industry every single day”.

Beyond financial support, Soft2Bet Invest provides strategic support, including access to its technology stack and operational expertise. The fund aims to drive exponential growth and redefine the industry by nurturing a new generation of out-of-the-box thinkers. Following the fund’s launch, Soft2Bet Invest received the “Outstanding Contribution to Gaming 2024” award at SiGMA East Europe. This achievement is truly a commitment to innovation and industry advancement.

Promoting Jewish Education

Four years before Soft2Bet Invest, Uri and his wife, Yael, launched a Foundation affectionately named after the wife – the Yael Foundation. It aims to provide Jewish culture, language, heritage and education to every Jewish child. It stands for protecting Jewish identity and is driven by a mission that every Jewish child, regardless of location, is entitled to access exceptional Jewish and general education.

Key Achievements of the Yael Foundation so far:

  • Global reach has impacted more than 13,500 Jewish students in over 37 countries.
  • €21.8 million in grants have been allocated yearly to support Jewish education initiatives.
  • One hundred projects launched in 2024 alone, enhancing education opportunities worldwide.
  • Security programs have been successfully implemented to protect Jewish communities across Europe.
  • The International Jewish School Leadership Exchange was introduced to foster global collaboration among Jewish educators.

Supporting Underserved Communities and Animals

The most recent charitable venture launched by the company is the Soft2Bet Foundation. It reflects the company’s core beliefs that corporate success has to uplift others and not just serve itself. The Foundation covers many areas, including but not limited to children’s education, humanitarian aid, environmental protection, promotion of clean energy and animal welfare. The Foundation’s mission is to use technology to improve human life, empower individualism, strengthen communal bonds and leave the planet a better place for future generations.

Rather than treating philanthropy as a secondary effort, Soft2Bet’s charity is deeply embedded in the company’s vision. All charitable initiatives have been created for a bigger reason: to make a long-lasting change in people’s lives. Through these efforts, it strives not only to give—but to inspire a culture of giving across the broader iGaming landscape.

Exploring 918Kiss Slot Features: What Sets It Apart

0

Exploring 918Kiss Slot Features uncovers a realm of unique gaming elements that distinguish it from the rest. From its intriguing bonus rounds to captivating gameplay features, 918Kiss offers a blend of excitement and innovation that keeps players intrigued. 

The fusion of top-tier visuals and enticing rewards sets the stage for an unparalleled slot experience. Yet, what truly sets 918Kiss apart lies beyond the surface, waiting to be unveiled.

Unique Bonus Rounds

Exploring 918Kiss slot features reveals a variety of unique bonus rounds that enhance the overall gaming experience for players. These bonus rounds are designed to captivate and engage users, providing an added layer of excitement to the gameplay. 

One standout bonus feature is the Free Spins round, often triggered by landing specific symbols on the reels. During this round, players can spin the reels without depleting their credits, offering the chance to accumulate winnings without any risk.

Another enticing bonus round is the Pick and Click feature, where players select from various symbols to reveal instant prizes such as cash rewards or multipliers. This interactive element adds a strategic dimension to the game, allowing players to feel more in control of their potential winnings. 

Additionally, some slots offer progressive bonus rounds, where players can unlock higher levels with increased rewards as they progress through the game. These innovative bonus rounds not only provide entertainment value but also incentivize players to continue spinning the reels in hopes of triggering these lucrative features.

Interactive Gameplay Features

Several 918Kiss slot games boast interactive gameplay features that actively engage players and elevate the overall gaming experience. These features go beyond traditional slot gameplay, offering players a more immersive and dynamic experience. 

One common interactive feature found in 918Kiss slots is the interactive bonus rounds. These bonus rounds often require players to make choices or interact with the game in some way to reveal prizes, adding an element of skill and strategy to the gameplay.

Moreover, some 918Kiss slots include interactive symbols that trigger special animations or mini-games when matched, providing players with additional entertainment and rewards. These interactive elements make the gameplay more engaging and enjoyable, keeping players entertained for longer periods. 

By incorporating these interactive features, 918Kiss slots set themselves apart from traditional slot games, offering a unique and interactive gaming experience that appeals to a wide range of players looking for more than just spinning reels.

High-Quality Graphics and Animation

The incorporation of high-quality graphics and animation in 918Kiss slots enhances the visual appeal and overall gaming experience for players. These elements are crucial in immersing players in the game’s theme, whether it’s exploring ancient civilizations, embarking on thrilling adventures, or enjoying classic fruit machine aesthetics. 

The attention to detail in the graphics, from vibrant colors to intricate designs, brings the slot games to life on the screen, captivating players and keeping them engaged.

Moreover, the fluidity of the animations adds another layer of excitement to the gameplay. Smooth transitions, dynamic movements, and visually appealing effects contribute to creating a more dynamic and interactive gaming experience.

Whether it’s the spinning reels, bonus rounds, or special features, the high-quality animation elevates the overall entertainment value of 918Kiss slots.

Players seeking a visually stimulating and engaging gaming experience in trusted gaming site such as https://www.1bet2umy.com/my/en-us/product/game/918kiss will appreciate the effort put into the graphics and animation of 918Kiss slots, setting them apart from other online slot games.

Generous Payout Rates

With generous payout rates, players in 918Kiss slots stand to benefit from potentially lucrative rewards for their gameplay. The platform is known for offering competitive payout rates compared to other online slot games, enhancing the overall gaming experience. 

Players have the opportunity to win substantial amounts of money through the various slot games available on 918Kiss. The generous payout rates create an added layer of excitement and motivation for players, keeping them engaged and entertained as they aim for those big wins.

Moreover, the transparent nature of the payout system on 918Kiss instills a sense of trust and reliability among players. Knowing that they have a fair chance of winning encourages players to continue exploring the different slot games offered by the platform. 

This transparency contributes to the positive reputation that 918Kiss has built within the online gaming community, attracting more players who seek a rewarding and trustworthy gaming experience.

Seamless Mobile Compatibility

Players experience a seamless transition to mobile gameplay when accessing 918Kiss slots, enhancing convenience and accessibility. The platform’s mobile compatibility ensures that players can enjoy their favorite slot games on the go, without compromising on quality or functionality. 

The responsive design of the 918Kiss platform adapts effortlessly to various screen sizes and operating systems, providing a smooth and enjoyable gaming experience across different devices. Whether players prefer using their smartphones or tablets, 918Kiss slots are optimized for mobile play, allowing users to immerse themselves in the excitement of slot games anytime, anywhere.

Moreover, the seamless mobile compatibility of 918Kiss slots extends to all aspects of the gaming experience, including graphics, animations, sound effects, and gameplay features. This attention to detail ensures that players can fully enjoy the immersive and engaging nature of slot games, even when playing on a mobile device. 

Overall, 918Kiss’s seamless mobile compatibility highlights its commitment to providing a user-friendly and inclusive gaming environment for players seeking convenience and entertainment on the go.

Charlotte vs Suburbs: Study Compares Cost of Living & Quality of Life in Major Metro Areas

0

Suburbs are assumed to have a higher quality of life than cities — at a much lower price. But how often is that the case in the Charlotte metro area?


Researchers at GOBankingRates analyzed the cost of living and quality of life in the largest cities in America — and compared them to nearby suburbs.

More specifically, we evaluated the annual cost of living and livability (scored 0-100) for three of the largest and most popular suburbs in each major metro area.

Key Findings Include:

  • Five major cities had livability scores of 80 or higher — a better score than many suburbs on our list. These cities include Dallas, Austin, Jacksonville, Charlotte and Orlando.
  • However, the best-rated suburbs score much higher than the best-rated cities on livability. Four suburbs had a livability score of 90 or higher: The Woodlands (near Houston), Admore (near Philadelphia), Lexington (near Boston) and Farmington (near Detroit).
  • The cost of living in suburbs is not drastically cheaper in most places. Just three suburbs had a cost of living that was $10,000+ cheaper: Kannapolis (outside of Charlotte), Plugerville (outside of Austin) and Renton (outside of Seattle) have the biggest cost of living differences from their cities.

The study compared the following metros and found:

Annual Cost of Living in New York City Metro

  • New York: $91,153
    • Livability score: 75
  • New Rochelle, New York: $90,318
    • Livability score: 70
  • Yonkers, New York: $79,802
    • Livability score: 67
  • Jericho, New York: $117,886
    • Livability score: 77 

Annual Cost of Living in Los Angeles Metro

  • Los Angeles: $100,697
    • Livability score: 67
  • Arcadia, California: $182,843
    • Livability score: 77 
  • Burbank, California: $115,401
    • Livability score: 74
  • Pasadena, California: $119,170
    • Livability score: 73

Annual Cost of Living in Chicago Metro

  • Chicago, IL:  $48,231
    • Livability score: 78
  • Aurora, Illinois: $42,821
    • Livability score: 71
  • Elgin, Illinois:  $45,807
    • Livability score: 82   
  • Schaumburg, Ilinois: $53,123
    • Livability score: 78

Annual Cost of Living in Houston Metro

  • Houston: $44,452
    • Livability score: 74
  • The Woodlands, Texas: $57,783
    • Livability score: 91
  • Pearland, Texas: $52,272
    • Livability score: 81
  • Sugar Land, Texas: $57,816
    • Livability score: 80

Annual Cost of Living in Phoenix Metro

  • Phoenix: $55,661
    • Livability score: 76
  • Goodyear, Arizona: $85,714
    • Livability score: 76
  • Chandler, Arizona: $63,076
    • Livability score: 79
  • Gilbert, Arizona: $66,797
    • Livability score: 89

Annual Cost of Living in Philadelphia Metro

  • Philadelphia: $43,344
    • Livability score: 76
  • Ardmore, Pennsylvania: $60,812
    • Livability score: 93
  • Conshohocken, Pennsylvania: $59,227
    • Livability score: 89
  • Exton, Pennsylvania: $67,220
    • Livability score: 88

Annual Cost of Living in Dallas Metro

  • Dallas: $48,597
    • Livability score: 81
  • McKinney, Texas: $57,310
    • Livability score: 74
  • Denton, Texas: $49,494
    • Livability score: 85
  • Prosper, Texas: $82,962
    • Livability score: 70

Annual Cost of Living in Austin, Texas, Metro

  • Austin, Texas: $48,597
    • Livability score: 83
  • Pflugerville, Texas: $50,955
    • Livability score: 82
  • Leander, Texas: $57,487
    • Livability score: 81
  • Georgetown, Texas: $56,681
    • Livability score: 83

Annual Cost of Living in Jacksonville, Florida, Metro

  • Jacksonville, Florida: $46,335
    • Livability score: 84
  • Oakleaf Plantation, Florida: $44,525
    • Livability score: 70
  • Orange Park, Florida: $48,166
    • Livability score: 76
  • Fernandina Beach, Florida: $68,410
    • Livability score: 72

Annual Cost of Living in Charlotte, North Carolina, Metro

  • Charlotte, North Carolina: $52,767
    • Livability score: 80
  • Matthews, North Carolina: $56,300
    • Livability score: 83
  • Kannapolis, North Carolina: $41,887
    • Livability score: 64
  • Davidson, North Carolina: $74,190
    • Livability score: 75

 Annual Cost of Living in Seattle Metro

  • Seattle: $92,451
    • Livability score: 75
  • Mercer Island, Washington: $180,287
    • Livability score: 75
  • Shoreline, Washington: $85,621
    • Livability score: 84
  • Renton, Washington: $81,633
    • Livability score: 82

 Annual Cost of Living in Denver Metro

  • Denver: $67,936
    • Livability score: 72
  • Centennial, Colorado: $68,367
    • Livability score: 80
  • Thornton, Colorado: $63,044
    • Livability score: 81
  • Littleton, Colorado: $72,640
    • Livability score: 71

 Annual Cost of Living in Nashville, Tennessee, Metro

  • Nashville, Tennessee: $56,069
    • Livability score: 78
  • Smyrna, Tennessee: $49,708
    • Livability score: 76
  • Franklin, Tennessee: $89,027
    • Livability score: 75
  • Hendersonville, Tennessee: $60,163
    • Livability score: 70

 Annual Cost of Living in Boston Metro

  • Boston: $85,229
    • Livability score: 77
  • Lexington, Massachusetts: $131,836
    • Livability score: 92
  • Cambridge, Massachusetts: $152,776
    • Livability score: 86
  • Newton, Massachusetts: $143,547
    • Livability score: 84

 Annual Cost of Living in Detroit Metro

  • Detroit: $32,782
    • Livability score: 73
  • Farmington, Michigan: $47,651
    • Livability score: 91
  • Beverly Hills, Michigan: $62,695
    • Livability score: 83
  • Bloomfield Hills, Michigan: $74,269
    • Livability score: 72

 Annual Cost of Living in Atlanta Metro

  • Atlanta: $57,437
    • Livability score: 78
  • Roswell, Georgia: $69,060
    • Livability score: 80
  • Decatur, Georgia: $47,806
    • Livability score: 87
  • Johns Creek, Georgia: $75,996
    • Livability score: 66

 Annual Cost of Living in Orlando, Florida, Metro

  • Orlando, Florida: $54,589
    • Livability score: 81
  • Horizon West, Florida: $55,450
    • Livability score: 72
  • Winter Park, Florida: $61,214
    • Livability score: 84
  • Altamonte Springs, Florida: $52,337
    • Livability score: 82

 Annual Cost of Living in Newark, New Jersey, Metro

  • Newark, New Jersey: $63,385
    • Livability score: 67
  • North Caldwell, New Jersey: $103,675
    • Livability score: 71
  • Essex Fells, New Jersey: $125,781
    • Livability score: 74
  • Passaic, New Jersey: $68,235
    • Livability score: 60

PPG Building New $380 Million Factory Just West of Charlotte

0

Global coatings giant PPG has announced plans to build a $380 million factory just to the west of Charlotte in Shelby, returning its brand to Cleveland County for the first time since the 1950s.

The project will create 110 new jobs, with an average salary of $66,861, significantly above Cleveland County’s current average wage of $48,310.

PPG will construct a 198,000-square-foot plant on a 62-acre site, producing its full line of aerospace coatings and sealants used in commercial, general aviation, and military aircraft.

“PPG knows what I know: North Carolina is the #1 state for manufacturing in the Southeast,” said Governor Josh Stein in a press release. “Our state’s workforce is our greatest asset, and I will continue to advocate for more training and education programs so that employees can build a career and employers have the well-trained people they need to get to work.”

Construction is expected to begin in October 2025, with operations launching in 2027.

The state will support the project with a $300,000 performance-based grant from the One North Carolina Fund, based on the creation of 62 jobs and a capital investment of $221.8 million. All grant funds are contingent on local matching contributions and job creation benchmarks.

PPG, a Fortune 500 company operating in more than 70 countries, reported $15.8 billion in net sales in 2024.

This new Shelby plant will strengthen its aerospace division, which provides coatings, sealants, and materials to OEMs, airlines, and military maintenance operations worldwide.

Severe Storms Coming To Charlotte Today w/ Possible Hail, Flash Flooding, and Tornados

0

Everyone around the Charlotte region should stay weather alert today as a potent upper-level disturbance over the Tennessee Valley, is now pulling energy and wind shear toward the Carolinas. The fast-moving system could bring strong-to-severe thunderstorms to our area this afternoon and evening.
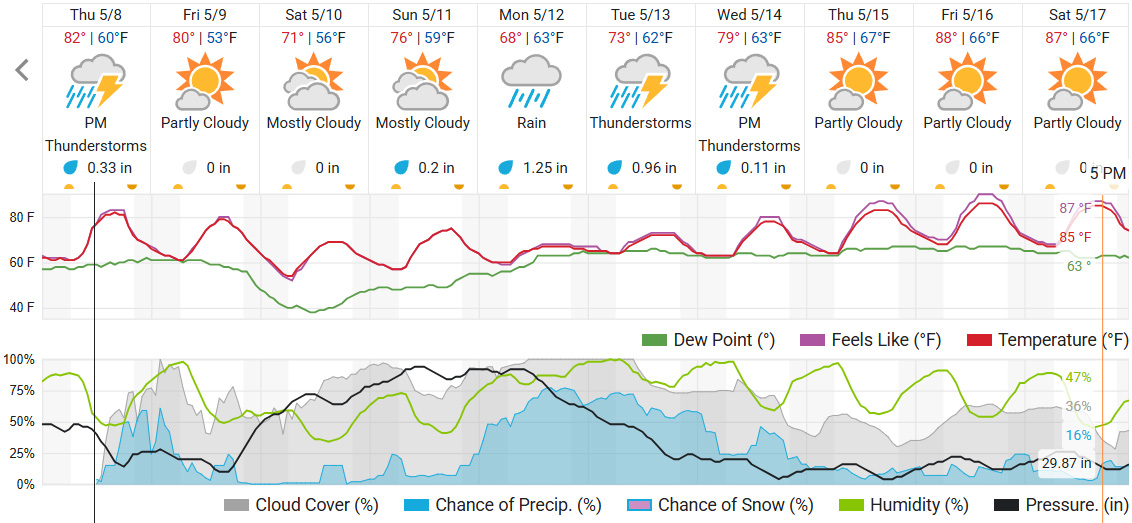
The National Weather Service warns that storms may bring damaging winds, heavy rain, large hail up to 2 inches, and localized flash flooding. There’s also a low risk of an isolated tornado.

For the Charlotte metro area, the severe weather window will extend from 4 p.m. to around 10 p.m., with storms possibly lingering into the night.

At the surface, warm daytime heating and rising mid-level lapse rates are priming the atmosphere ahead of a cold front due Friday.

Looking Ahead:

  • Friday: Scattered storms possible in the early morning.

  • Saturday and Sunday: Warm and cloudy.

  • Next week: Rain returns with a cold-air damming wedge setting up.

via WeatherUnderground

Charlotte Saw 9.8% Increase in Retail Businesses – 5th Highest in US

0

The recent new tariffs—including a 145% duty on Chinese imports—have already pushed retailers like Shein and Temu to raise prices, while major chains like Walmart, Target, and Home Depot are warning of looming supply shortages and higher costs for American shoppers. As retail businesses brace for disruption, many of the fastest-growing areas for brick-and-mortar stores may also be the most vulnerable.
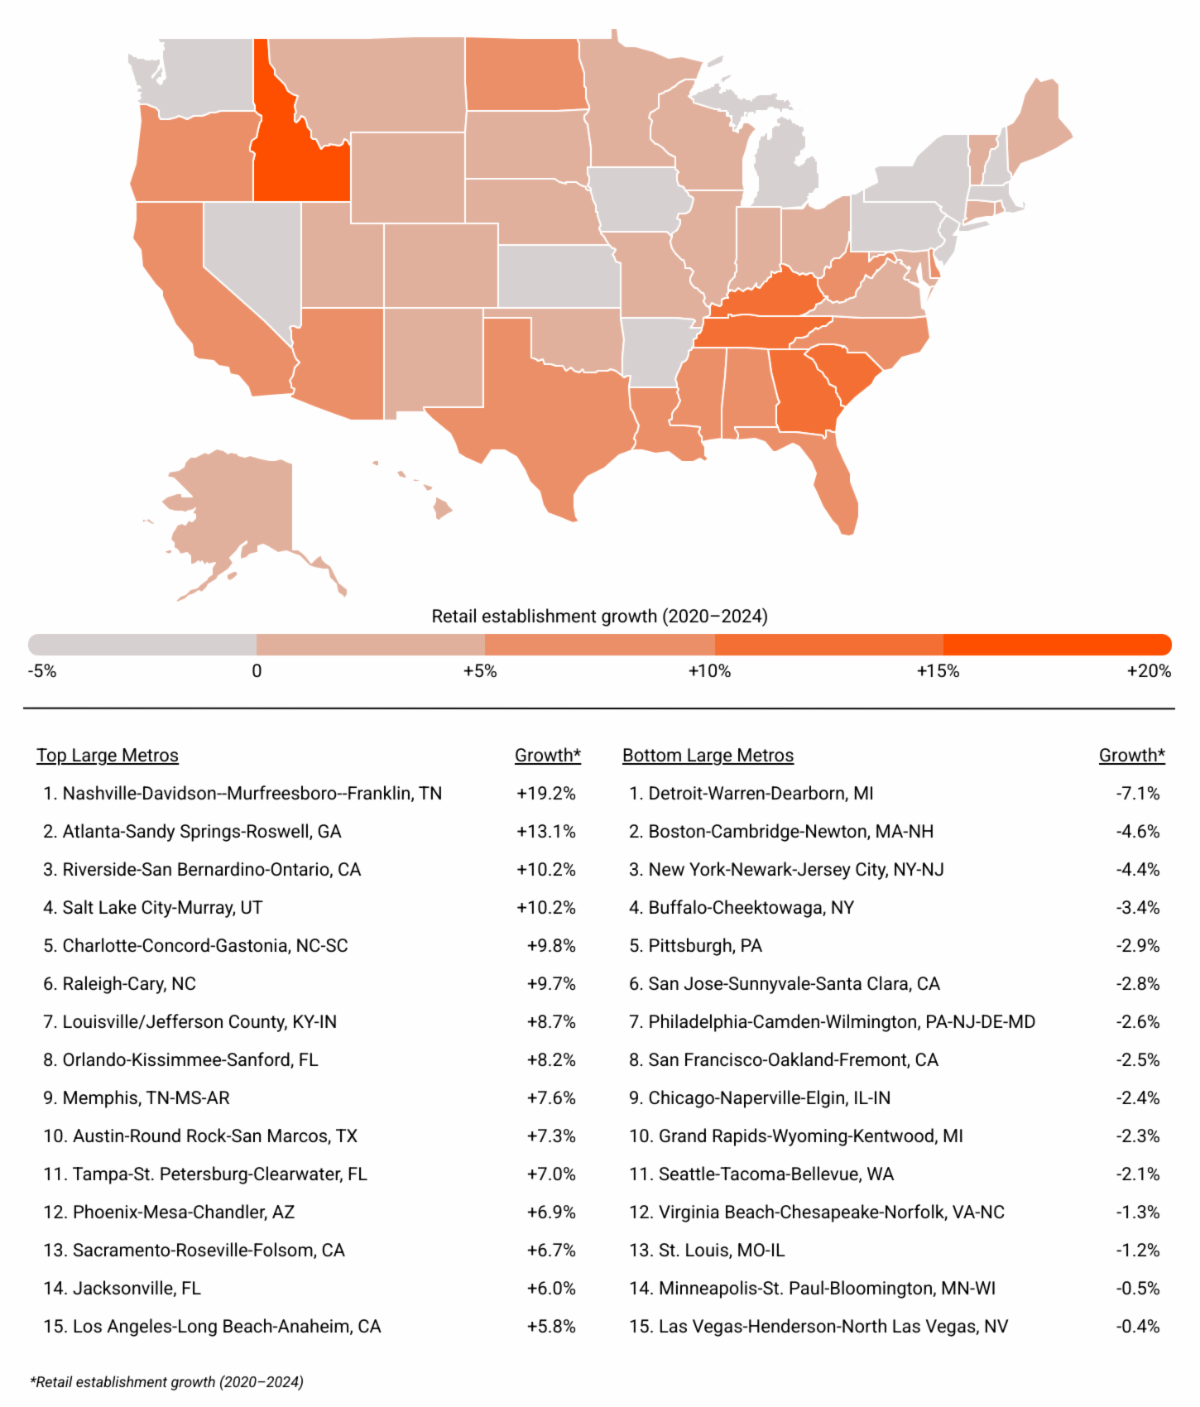

A recent analysis from Printastic spotlights the U.S. cities and states where physical retail is growing (and shrinking) fastest, and which locations could face new headwinds just as in-person shopping was beginning to recover.

Key Takeaways, With Data for Charlotte-Concord-Gastonia, NC-SC

  • Retail’s Long Decline—and Fragile Recovery: Over the past 20 years, retail establishment growth (+4.8%) has lagged far behind total U.S. business growth (+49.4%), with major setbacks during the Great Recession and COVID-19 pandemic.
  • Post-Pandemic Gains Face New Threats: From 2020 to 2024, the sector added over 38,000 new stores and 870,000 jobs—the strongest retail expansion in decades—raising the stakes as new tariffs take hold.
  • Southeastern and Western States Lead in Retail Growth: States like Idaho (+18.8%), Tennessee (+14.5%), and Georgia (+12.5%) posted the highest retail growth since 2020, while parts of the Northeast and Midwest posted declines.
  • Metro-Level Growth Could Stall: In the metros where retail has grown between 2020 and 2024, rising costs could test the durability of those gains—while metros reporting losses may face rising vacancies and an even slower path to recovery if tariffs weaken consumer demand.
  • How Retail Has Fared in the Charlotte metro: Between 2020 and 2024, the Charlotte metro gained 793 retail establishments—an increase of 9.8%, the 5th highest of any large metro. Meanwhile, retail employment increased by 12,833 workers (+10.5%) during that span.

The Hot Wheels Legends Tour Rolls into Charlotte in Search of the Next Hot Wheels Die-Cast

0

On May 17, the Hot Wheels Legends Tour, the world’s largest traveling car show and  global contest offering custom car builders the unique opportunity to have their passion projects turned into the next Hot Wheels die-cast toy car, rolls into the Charlotte area.

At this free, family friendly event, Hot Wheels designers and local celebrity judges will examine each vehicle based on three key categories: authenticity, creativity, and garage spirit. The winner of the event will move on to the national semi-final later this year for a chance to represent the U.S. in the Global finale.

The judges are seeking extreme, on-trend, and relevant vehicles while also considering overall creativity. Extra points are awarded when late-nights, early mornings, grit, and determination are evident in the build.

In addition to more than 100 unique vehicles, the Charlotte Hot Wheels Legends Tour event will include activities for fans of all ages, including the Hot Wheels Garage of Legends life-size cars, play spaces where kids can interact with the latest Hot Wheels toys, and Hot Wheels die-cast displays featuring coveted premium and collector cars. Additionally, Hot Wheels enthusiasts can find special edition Hot Wheels Legends products only available on tour.

Charlotte-Based Fintech Firm AvidXchange Is Being Sold for $2.2 Billion

0

Charlotte-based fintech company AvidXchange is being acquired for $2.2 billion in an all-cash deal by private equity firm TPG and global payments company Corpay, according to a company announcement this morning.

The transaction, valued at $10 per share, represents a 22% premium over AvidXchange’s May 6 closing price of $8.20 and a 45% premium over its March 12 closing price, the day before reports of a potential sale emerged. Once the deal closes, AvidXchange will become a private company

TPG, based in San Francisco, will take a majority stake through its U.S. and European private equity platform. Atlanta-based Corpay will hold a minority interest in the company.

“We are pleased to have reached an agreement that delivers significant value for AvidXchange stockholders and positions our business for long-term growth and success for our valued customers,” said AvidXchange CEO Michael Praeger in a press release. “Over the last 25 years, AvidXchange has established itself as a leader in AP automation and payment software by building a differentiated platform primed for growth. With TPG and Corpay, we will have the resources and long-term focus to scale our platform and provide more innovative solutions that help our customers across the country transform their accounts payable processes.”

Founded in 2000 by CEO Michael Praeger and co-founder David Miller in a Charlotte coffee shop, AvidXchange grew into a major fintech player, going public in 2021 and employing 1,600 people nationwide—with nearly 1,200 based in Charlotte.

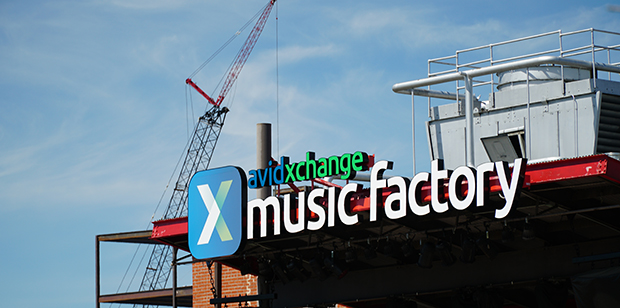
In 2017, AvidXchange moved into its headquarters at the Music Factory, and secured naming rights to the venue.

The sale is expected to close in the fourth quarter of 2025, pending shareholder and regulatory approvals. No financing conditions are attached to the deal.

Griffin Concedes NC Supreme Court Race After Judge Upholds Ballots

0

Republican Jefferson Griffin conceded to Democratic Justice Allison Riggs on Wednesday, ending a legal battle over thousands of challenged ballots in the North Carolina Supreme Court race.

Griffin’s concession followed U.S. District Judge Richard Myers’ ruling upholding the ballots and ordering certification of Riggs’ 734-vote victory out of over 5.5 million cast.

Griffin, whose term on the Court of Appeals ends in 2028, said he would not appeal in a public statement.

Myers found that removing ballots, initially challenged in six Democratic-leaning counties, would violate voters’ constitutional rights.

Riggs’ win secures an eight-year term and boosts Democrats’ chances of regaining the state Supreme Court majority.

Data Study: It Takes 14.5 Years to Save for Charlotte Down Payment

0

For much of the past decade, a 20% down payment was enough to make homeownership feasible in most U.S. cities—typically requiring around six years of saving. That standard no longer holds: as mortgage rates and home prices have surged, the gap between what buyers can afford and what homes cost has widened dramatically.

While these housing affordability challenges exist nationwide, some areas give potential buyers shorter savings timelines than others. A new analysis from Upgraded Points examines how long it would take the typical household to save for a home in cities across the U.S., based on current home prices, mortgage rates, incomes, and other housing-related costs.

Key Takeaways, With Data for Charlotte, NC

  • 41% Down Is the New 20%: In 2025, the typical U.S. household would need a 41% down payment—about $148,000—and nearly 13 years of saving to afford the median-priced home.
  • Few Cities Remain Affordable: In just 4 of America’s 54 largest cities could a buyer afford the monthly payments with 20% down or less.
  • Borrowing Power for Charlotte Homebuyers: Earning the city’s median income of $83,204, the typical household in Charlotte can afford to borrow $222,388 of the $398,872 median home price. This leaves a required down payment of about $176K (44.2% of the purchase price).
  • Charlotte Buyers Need 14.5 Years to Save: Assuming buyers spend no more than 30% of their income on housing, invest 10% of their gross income, and earn a 5% annual return, it would take the typical Charlotte household 14.5 years to save the required down payment.

How Long Does It Take To Save for a Home in Every U.S. City?

1 Los Angeles, CA 35.1 $814,336 82.6% $986,145 $171,809 $85,249 $2,131 $1,124 $1,008
2 Miami, FL 31.6 $483,530 81.7% $591,524 $107,994 $62,998 $1,575 $706 $869
3 San Jose, CA 31.2 $1,123,731 73.4% $1,531,233 $407,502 $150,166 $3,754 $2,665 $1,089
4 New York, NY 31.0 $624,228 81.3% $767,759 $143,531 $84,556 $2,114 $939 $1,175
5 Long Beach, CA 30.3 $629,753 73.2% $860,458 $230,705 $89,071 $2,227 $1,509 $718
6 San Diego, CA 29.4 $736,318 71.6% $1,028,632 $292,314 $110,659 $2,766 $1,912 $855
7 San Francisco, CA 27.5 $882,233 67.7% $1,302,230 $419,997 $150,040 $3,751 $2,746 $1,005
8 Boston, MA 26.1 $537,400 70.9% $757,504 $220,104 $100,512 $2,513 $1,439 $1,073
9 Oakland, CA 25.2 $520,521 68.8% $756,579 $236,058 $103,285 $2,582 $1,544 $1,038
10 Seattle, WA 23.5 $576,430 64.8% $888,951 $312,522 $129,396 $3,235 $2,044 $1,191
11 Portland, OR 20.1 $324,817 60.0% $541,664 $216,848 $94,187 $2,355 $1,418 $937
12 Austin, TX 19.6 $320,833 60.9% $526,444 $205,611 $97,018 $2,425 $1,345 $1,081
13 Tucson, AZ 19.5 $189,928 57.5% $330,025 $140,096 $57,860 $1,447 $916 $530
14 Las Vegas, NV 18.7 $230,908 53.5% $431,579 $200,671 $75,020 $1,876 $1,312 $563
15 Denver, CO 18.5 $296,079 52.7% $561,628 $265,549 $97,251 $2,431 $1,736 $695
16 Fresno, CA 18.5 $215,478 55.6% $387,604 $172,125 $70,863 $1,772 $1,126 $646
17 Sacramento, CA 17.9 $256,281 52.6% $487,408 $231,127 $88,842 $2,221 $1,511 $710
18 Nashville-Davidson, TN 17.8 $228,284 52.3% $436,392 $208,109 $79,766 $1,994 $1,361 $633
19 Washington, DC 17.5 $315,701 51.9% $607,877 $292,176 $112,745 $2,819 $1,911 $908
20 Aurora, CO 17.4 $247,583 50.7% $488,471 $240,888 $89,443 $2,236 $1,575 $661
21 Mesa, AZ 16.2 $207,772 47.1% $440,951 $233,179 $83,566 $2,089 $1,525 $564
22 Tampa, FL 16.2 $187,776 49.4% $380,089 $192,313 $75,634 $1,891 $1,258 $633
23 Raleigh, NC 16.1 $214,790 48.7% $441,338 $226,548 $87,432 $2,186 $1,481 $704
24 Colorado Springs, CO 15.9 $214,635 46.8% $458,759 $244,124 $88,253 $2,206 $1,596 $610
25 Phoenix, AZ 15.7 $193,750 46.3% $418,907 $225,157 $81,722 $2,043 $1,472 $571
26 Bakersfield, CA 15.4 $189,131 47.9% $394,482 $205,351 $82,100 $2,052 $1,343 $710
27 Albuquerque, NM 15.1 $156,223 46.5% $336,297 $180,074 $69,590 $1,740 $1,178 $562
28 Atlanta, GA 14.8 $189,739 48.2% $393,553 $203,814 $86,916 $2,173 $1,333 $840
29 Dallas, TX 14.7 $156,278 50.1% $312,165 $155,888 $71,877 $1,797 $1,019 $778
30 Charlotte, NC 14.5 $176,484 44.2% $398,872 $222,388 $83,204 $2,080 $1,454 $626
31 New Orleans, LA 14.3 $122,504 51.5% $238,078 $115,574 $58,701 $1,468 $756 $712
32 Arlington, TX 13.3 $147,628 46.7% $315,840 $168,212 $77,986 $1,950 $1,100 $850
33 Milwaukee, WI 13.2 $102,472 49.4% $207,457 $104,985 $55,041 $1,376 $687 $689
34 Houston, TX 12.8 $119,615 44.5% $268,584 $148,969 $66,715 $1,668 $974 $694
35 Chicago, IL 12.2 $134,212 44.3% $302,972 $168,760 $79,699 $1,992 $1,104 $889
36 Virginia Beach, VA 11.9 $156,037 38.2% $408,787 $252,750 $96,195 $2,405 $1,653 $752
37 Minneapolis, MN 11.4 $130,248 40.0% $325,347 $195,099 $85,146 $2,129 $1,276 $853
38 Jacksonville, FL 11.1 $105,145 36.3% $289,992 $184,847 $71,051 $1,776 $1,209 $568
39 Omaha, NE 10.9 $110,942 39.2% $283,327 $172,385 $77,126 $1,928 $1,127 $801
40 San Antonio, TX 10.7 $94,615 37.4% $253,248 $158,633 $66,740 $1,668 $1,037 $631
41 Fort Worth, TX 10.5 $112,523 37.2% $302,646 $190,123 $81,256 $2,031 $1,243 $788
42 El Paso, TX 9.8 $78,152 34.5% $226,634 $148,483 $62,303 $1,558 $971 $587
43 Columbus, OH 9.4 $82,681 33.6% $245,897 $163,216 $69,296 $1,732 $1,067 $665
44 Louisville/Jefferson County, KY 9.0 $77,733 31.3% $248,427 $170,694 $68,664 $1,717 $1,116 $600
45 Philadelphia, PA 8.3 $66,507 29.7% $224,090 $157,583 $64,386 $1,610 $1,030 $579
46 Tulsa, OK 7.9 $59,790 29.2% $204,676 $144,886 $61,956 $1,549 $947 $601
47 Kansas City, MO 7.7 $66,690 27.7% $240,944 $174,255 $71,547 $1,789 $1,139 $649
48 Indianapolis, IN 7.2 $58,222 25.7% $226,904 $168,682 $66,822 $1,671 $1,103 $568
49 Baltimore, MD 6.6 $49,068 26.3% $186,557 $137,489 $63,246 $1,581 $899 $682
50 Cleveland, OH 6.0 $28,745 25.4% $113,044 $84,299 $41,568 $1,039 $551 $488
51 Wichita, KS 5.2 $39,517 20.0% $197,584 $162,993 $66,904 $1,673 $1,066 $607
52 Oklahoma City, OK 5.0 $40,393 20.0% $201,963 $173,821 $70,755 $1,769 $1,137 $632
53 Memphis, TN 4.8 $29,268 20.0% $146,339 $121,867 $54,323 $1,358 $797 $561
54 Detroit, MI 3.4 $15,379 20.0% $76,894 $77,275 $41,980 $1,049 $505 $544