
 With house flippers earning an average gross profit of $60,000 in Q1 2019, the personal-finance website WalletHub today released its report on 2019’s Best Places to Flip Houses.
To help serious real-estate investors find the best markets to list their flipped properties, the company compared more than 170 U.S. cities across 29 key metrics. The data set ranges from median purchase price to average full home remodeling costs to housing-market health index.
According to the report, Greensboro ranked among the top 10 in the nation at #8, ahead of Boise, ID (#9) and Las Cruces, NM (#10) and just behind Fort Smith, AR (#7) and Tampa, FL (#6).
Charlotte was ranked in the top half of cities at #64, just ahead of Fort Worth and Plano Texas (#66 and #65) and just behind Winston Salem, Meza, AZ, and Denver, CO (#63, #62, and #61)
Best & Worst Cities to Flip Houses
| Overall Rank (1 = Best) | City | Total Score | ‘Market Potential’ Rank | ‘Renovation & Remodeling Costs’ Rank | ‘Quality of Life’ Rank |
|---|---|---|---|---|---|
| 1 | Sioux Falls, SD | 72.69 | 78 | 9 | 26 |
| 2 | Missoula, MT | 72.05 | 2 | 34 | 23 |
| 3 | Rapid City, SD | 67.67 | 62 | 11 | 96 |
| 4 | Billings, MT | 67.17 | 5 | 30 | 79 |
| 5 | Peoria, AZ | 67.17 | 88 | 7 | 11 |
| 6 | Tampa, FL | 66.63 | 21 | 25 | 42 |
| 7 | Fort Smith, AR | 65.98 | 133 | 1 | 131 |
| 8 | Greensboro, NC | 65.84 | 14 | 12 | 97 |
| 9 | Las Cruces, NM | 65.58 | 119 | 6 | 129 |
| 10 | Boise, ID | 65.40 | 135 | 8 | 19 |
| 11 | Henderson, NV | 65.28 | 58 | 41 | 12 |
| 12 | Columbia, SC | 65.11 | 8 | 14 | 122 |
| 13 | Mobile, AL | 65.02 | 1 | 23 | 158 |
| 14 | Gilbert, AZ | 64.54 | 73 | 69 | 2 |
| 15 | Knoxville, TN | 64.54 | 11 | 13 | 123 |
| 16 | Fort Wayne, IN | 64.00 | 23 | 19 | 105 |
| 17 | Chandler, AZ | 63.89 | 65 | 47 | 14 |
| 18 | Charleston, SC | 63.76 | 26 | 66 | 18 |
| 19 | Overland Park, KS | 63.24 | 86 | 82 | 1 |
| 20 | Nampa, ID | 62.90 | 159 | 2 | 67 |
| 21 | Little Rock, AR | 62.86 | 36 | 5 | 135 |
| 22 | Laredo, TX | 62.86 | 169 | 40 | 69 |
| 23 | Des Moines, IA | 62.63 | 95 | 4 | 84 |
| 24 | Oklahoma City, OK | 62.59 | 47 | 18 | 90 |
| 25 | Cape Coral, FL | 62.57 | 27 | 78 | 15 |
| 26 | Nashville, TN | 62.34 | 66 | 16 | 76 |
| 27 | Pembroke Pines, FL | 62.04 | 50 | 72 | 13 |
| 28 | Las Vegas, NV | 61.99 | 46 | 33 | 61 |
| 29 | Orlando, FL | 61.52 | 49 | 29 | 78 |
| 30 | Jackson, MS | 61.03 | 127 | 3 | 168 |
| 31 | Virginia Beach, VA | 60.91 | 43 | 79 | 20 |
| 32 | El Paso, TX | 60.50 | 149 | 17 | 65 |
| 33 | Spokane, WA | 60.41 | 12 | 54 | 126 |
| 34 | Tempe, AZ | 60.35 | 48 | 55 | 57 |
| 35 | Glendale, AZ | 60.34 | 74 | 20 | 108 |
| 36 | Colorado Springs, CO | 60.32 | 81 | 49 | 41 |
| 37 | Shreveport, LA | 60.24 | 6 | 10 | 170 |
| 38 | Grand Rapids, MI | 60.02 | 106 | 37 | 37 |
| 39 | Phoenix, AZ | 59.98 | 79 | 26 | 91 |
| 40 | Huntsville, AL | 59.91 | 20 | 58 | 109 |
| 41 | Tallahassee, FL | 59.80 | 40 | 39 | 112 |
| 42 | Lincoln, NE | 59.62 | 94 | 53 | 31 |
| 43 | Columbus, OH | 59.53 | 42 | 61 | 72 |
| 44 | Raleigh, NC | 59.37 | 103 | 52 | 25 |
| 45 | North Las Vegas, NV | 59.10 | 61 | 36 | 103 |
| 46 | Cedar Rapids, IA | 58.82 | 93 | 32 | 100 |
| 47 | Montgomery, AL | 58.73 | 16 | 28 | 159 |
| 48 | Scottsdale, AZ | 58.66 | 71 | 113 | 5 |
| 49 | West Valley City, UT | 58.58 | 120 | 31 | 86 |
| 50 | Jacksonville, FL | 58.46 | 29 | 74 | 92 |
| 51 | Tulsa, OK | 58.38 | 56 | 22 | 143 |
| 52 | Lexington-Fayette, KY | 58.28 | 52 | 83 | 80 |
| 53 | Reno, NV | 58.11 | 99 | 68 | 27 |
| 54 | Durham, NC | 58.08 | 33 | 77 | 81 |
| 55 | Charleston, WV | 57.97 | 90 | 51 | 134 |
| 56 | Austin, TX | 57.81 | 157 | 80 | 17 |
| 57 | Tucson, AZ | 57.77 | 69 | 21 | 141 |
| 58 | Akron, OH | 57.58 | 22 | 56 | 145 |
| 59 | San Antonio, TX | 57.56 | 144 | 27 | 98 |
| 60 | Salem, OR | 57.53 | 37 | 87 | 49 |
| 61 | Denver, CO | 57.53 | 112 | 67 | 29 |
| 62 | Mesa, AZ | 57.50 | 80 | 81 | 39 |
| 63 | Winston-Salem, NC | 57.47 | 35 | 59 | 127 |
| 64 | Charlotte, NC | 56.89 | 55 | 85 | 50 |
| 65 | Plano, TX | 56.76 | 104 | 118 | 4 |
| 66 | Fort Worth, TX | 56.72 | 141 | 57 | 47 |
| 66 | Columbus, GA | 56.72 | 3 | 70 | 166 |
| 68 | Memphis, TN | 56.71 | 4 | 43 | 171 |
| 69 | New Orleans, LA | 56.61 | 45 | 48 | 140 |
| 70 | St. Petersburg, FL | 56.52 | 44 | 91 | 60 |
| 71 | Augusta, GA | 56.51 | 31 | 46 | 163 |
| 72 | Omaha, NE | 56.49 | 92 | 84 | 36 |
| 73 | Modesto, CA | 56.18 | 82 | 60 | 102 |
| 74 | Indianapolis, IN | 55.93 | 57 | 42 | 148 |
| 75 | Salt Lake City, UT | 55.69 | 110 | 75 | 51 |
| 76 | Kansas City, MO | 55.64 | 134 | 45 | 113 |
| 77 | Cincinnati, OH | 55.61 | 24 | 92 | 110 |
| 78 | Columbia, MD | 55.59 | 15 | 117 | 58 |
| 79 | Grand Prairie, TX | 55.52 | 140 | 71 | 33 |
| 80 | Fort Lauderdale, FL | 55.50 | 60 | 65 | 121 |
| 81 | Louisville, KY | 55.46 | 76 | 62 | 115 |
| 82 | Port St. Lucie, FL | 55.42 | 70 | 99 | 32 |
| 83 | Arlington, TX | 55.42 | 136 | 44 | 99 |
| 84 | Springfield, MO | 55.32 | 137 | 15 | 154 |
| 85 | Portland, ME | 55.19 | 32 | 119 | 34 |
| 86 | Buffalo, NY | 54.93 | 10 | 104 | 114 |
| 87 | Baton Rouge, LA | 54.91 | 13 | 64 | 162 |
| 88 | Rancho Cucamonga, CA | 54.69 | 116 | 106 | 9 |
| 89 | Fayetteville, NC | 54.57 | 102 | 38 | 161 |
| 90 | Chesapeake, VA | 54.52 | 75 | 89 | 63 |
| 91 | Hialeah, FL | 54.32 | 53 | 94 | 87 |
| 92 | Birmingham, AL | 54.03 | 7 | 101 | 144 |
| 93 | Aurora, CO | 53.86 | 125 | 76 | 66 |
| 94 | Wichita, KS | 53.70 | 154 | 24 | 147 |
| 95 | Pittsburgh, PA | 53.66 | 34 | 125 | 46 |
| 96 | Corpus Christi, TX | 53.33 | 129 | 62 | 130 |
| 97 | Lubbock, TX | 53.27 | 170 | 50 | 117 |
| 98 | Albuquerque, NM | 52.86 | 165 | 35 | 136 |
| 99 | Miami, FL | 52.79 | 89 | 98 | 70 |
| 100 | Amarillo, TX | 52.77 | 171 | 100 | 88 |
| 101 | Toledo, OH | 52.25 | 39 | 73 | 155 |
| 102 | Sacramento, CA | 52.22 | 122 | 93 | 54 |
| 103 | Richmond, VA | 52.12 | 38 | 109 | 116 |
| 104 | Irvine, CA | 51.94 | 121 | 143 | 3 |
| 105 | Washington, DC | 51.58 | 77 | 115 | 75 |
| 106 | Tacoma, WA | 51.55 | 41 | 97 | 139 |
| 107 | Norfolk, VA | 51.10 | 63 | 90 | 132 |
| 108 | St. Paul, MN | 51.05 | 107 | 108 | 52 |
| 109 | Garland, TX | 50.47 | 147 | 96 | 82 |
| 110 | Warwick, RI | 50.46 | 84 | 121 | 53 |
| 111 | Santa Clarita, CA | 50.19 | 164 | 128 | 8 |
| 112 | Chattanooga, TN | 49.66 | 17 | 134 | 125 |
| 113 | Madison, WI | 49.49 | 160 | 120 | 24 |
| 114 | Baltimore, MD | 49.43 | 18 | 103 | 164 |
| 115 | Cleveland, OH | 49.08 | 18 | 107 | 165 |
| 116 | Huntington, WV | 48.89 | 91 | 88 | 160 |
| 117 | Seattle, WA | 48.85 | 83 | 150 | 22 |
| 118 | Philadelphia, PA | 48.82 | 30 | 130 | 133 |
| 119 | Anchorage, AK | 48.73 | 166 | 105 | 128 |
| 120 | Fresno, CA | 48.68 | 85 | 116 | 119 |
| 121 | Vancouver, WA | 48.47 | 64 | 129 | 104 |
| 122 | Ontario, CA | 48.44 | 123 | 112 | 85 |
| 123 | Riverside, CA | 48.41 | 130 | 122 | 64 |
| 124 | Rochester, NY | 48.23 | 67 | 95 | 157 |
| 125 | Irving, TX | 48.08 | 148 | 123 | 59 |
| 126 | Minneapolis, MN | 47.74 | 101 | 135 | 62 |
| 127 | Newport News, VA | 47.64 | 59 | 114 | 149 |
| 128 | Milwaukee, WI | 47.60 | 54 | 111 | 151 |
| 129 | Detroit, MI | 47.55 | 51 | 86 | 169 |
| 130 | San Diego, CA | 47.23 | 138 | 146 | 16 |
| 131 | Portland, OR | 46.77 | 108 | 144 | 44 |
| 132 | Garden Grove, CA | 46.69 | 158 | 132 | 35 |
| 133 | Dallas, TX | 46.51 | 126 | 131 | 93 |
| 134 | Chula Vista, CA | 46.31 | 139 | 145 | 30 |
| 135 | Dover, DE | 45.86 | 109 | 139 | 77 |
| 136 | Oceanside, CA | 45.78 | 132 | 141 | 45 |
| 137 | Fontana, CA | 45.73 | 152 | 138 | 48 |
| 138 | Huntington Beach, CA | 45.70 | 145 | 158 | 7 |
| 139 | Nashua, NH | 45.55 | 114 | 142 | 56 |
| 140 | Providence, RI | 45.30 | 97 | 110 | 152 |
| 141 | Manchester, NH | 45.29 | 115 | 126 | 124 |
| 142 | Anaheim, CA | 45.10 | 156 | 136 | 71 |
| 143 | Stockton, CA | 45.03 | 87 | 124 | 146 |
| 144 | Houston, TX | 44.85 | 168 | 102 | 138 |
| 145 | Atlanta, GA | 44.58 | 28 | 162 | 95 |
| 146 | Honolulu, HI | 44.23 | 143 | 155 | 38 |
| 147 | Moreno Valley, CA | 44.11 | 131 | 133 | 107 |
| 148 | San Jose, CA | 44.07 | 96 | 167 | 10 |
| 149 | Santa Rosa, CA | 43.99 | 98 | 159 | 43 |
| 150 | Glendale, CA | 43.99 | 146 | 148 | 40 |
| 151 | Santa Ana, CA | 43.97 | 161 | 137 | 89 |
| 152 | St. Louis, MO | 43.95 | 25 | 156 | 142 |
| 153 | Long Beach, CA | 43.80 | 155 | 140 | 83 |
| 154 | Bakersfield, CA | 43.78 | 68 | 149 | 118 |
| 155 | Aurora, IL | 43.58 | 128 | 147 | 68 |
| 156 | Pearl City, HI | 43.42 | 100 | 151 | 28 |
| 157 | Fremont, CA | 41.87 | 150 | 170 | 6 |
| 158 | Chicago, IL | 41.77 | 117 | 152 | 111 |
| 159 | Worcester, MA | 41.55 | 72 | 153 | 137 |
| 160 | San Bernardino, CA | 41.40 | 124 | 127 | 156 |
| 161 | Jersey City, NJ | 38.58 | 105 | 165 | 73 |
| 162 | Oxnard, CA | 38.56 | 142 | 157 | 120 |
| 163 | Los Angeles, CA | 38.45 | 163 | 160 | 101 |
| 164 | New York, NY | 37.79 | 113 | 169 | 74 |
| 165 | New Haven, CT | 37.47 | 118 | 154 | 153 |
| 166 | Boston, MA | 37.46 | 151 | 168 | 55 |
| 167 | Wilmington, DE | 36.98 | 9 | 163 | 172 |
| 168 | San Francisco, CA | 35.30 | 167 | 172 | 21 |
| 169 | Oakland, CA | 34.64 | 162 | 166 | 106 |
| 170 | Newark, NJ | 33.57 | 111 | 164 | 150 |
| 171 | Yonkers, NY | 33.07 | 153 | 171 | 94 |
| 172 | Bridgeport, CT | 30.33 | 172 | 161 | 167 |
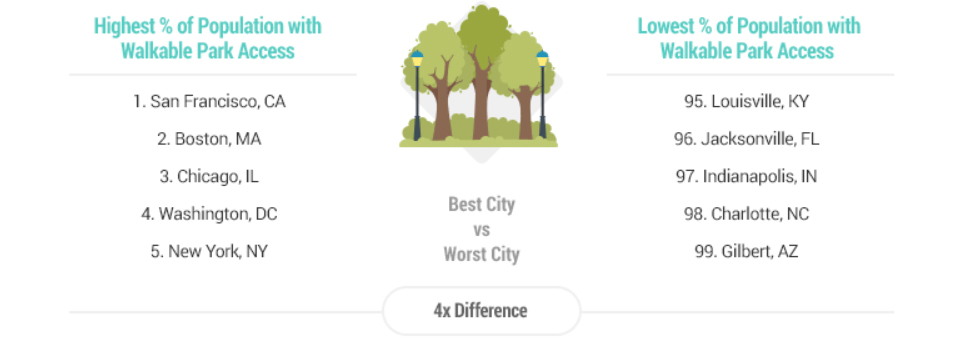
One of the factors that really hurt Charlotte is our lack of parks. The report even determined that we had the second lowest % population with walk-able park access in America;
You can read the full report here.

