
 With March being National Nutrition Month and obesity possibly tripling the risk of hospitalization due to COVID-19, the personal-finance website WalletHub today released its report on 2021’s Most Overweight and Obese Cities in the US.
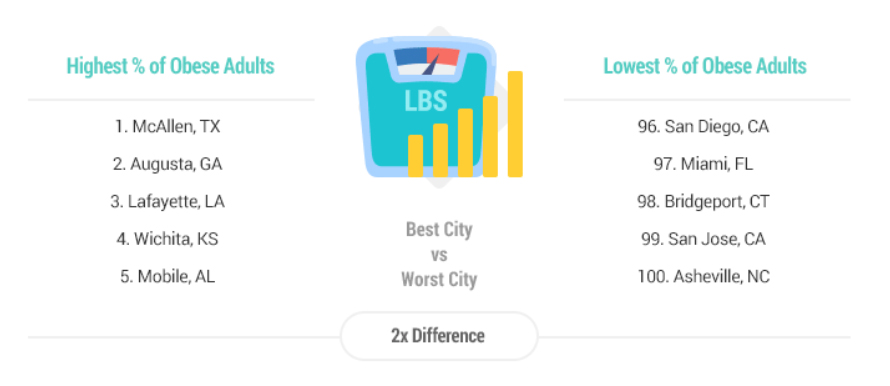
In order to call attention to the communities where weight-related problems are most prevalent, the site compared 100 of the most populated U.S. metro areas across 19 key metrics. Our data set ranges from the share of physically inactive adults to projected obesity rates by 2030 to healthy-food access.
4 cities in South Carolina ranked among the top 25 in the nation, including; Richmond County (#13), Greenville (#14), and Myrtle Beach (#16), and Charleston (#25). The lowest ranking city in North Carolina was Winston Salem at #27. Charlotte came in at #39 on the list.
Fattest Cities in the U.S.
| Overall Rank | Metro Area | Total Score | Obesity & Overweight | Health Consequences | Food & Fitness |
|---|---|---|---|---|---|
| 1 | McAllen-Edinburg-Mission, TX | 84.73 | 8 | 1 | 1 |
| 2 | Memphis, TN-MS-AR | 84.18 | 2 | 5 | 4 |
| 3 | Baton Rouge, LA | 83.65 | 7 | 2 | 7 |
| 4 | Little Rock-North Little Rock-Conway, AR | 83.22 | 1 | 16 | 12 |
| 5 | Shreveport-Bossier City, LA | 83.18 | 9 | 3 | 14 |
| 6 | Birmingham-Hoover, AL | 82.51 | 11 | 11 | 2 |
| 7 | Jackson, MS | 82.41 | 3 | 21 | 10 |
| 8 | Mobile, AL | 81.69 | 13 | 9 | 15 |
| 9 | Lafayette, LA | 81.40 | 16 | 13 | 11 |
| 10 | Knoxville, TN | 81.23 | 12 | 15 | 19 |
| 11 | Chattanooga, TN-GA | 80.88 | 5 | 26 | 18 |
| 12 | Tulsa, OK | 80.39 | 6 | 23 | 17 |
| 13 | Augusta-Richmond County, GA-SC | 79.94 | 29 | 10 | 5 |
| 14 | Greenville-Anderson, SC | 79.68 | 26 | 17 | 8 |
| 15 | Fayetteville-Springdale-Rogers, AR | 79.60 | 4 | 41 | 33 |
| 16 | Myrtle Beach-Conway-North Myrtle Beach, SC-NC | 79.24 | 33 | 4 | 29 |
| 17 | San Antonio-New Braunfels, TX | 78.77 | 18 | 7 | 43 |
| 18 | Wichita, KS | 78.68 | 34 | 19 | 3 |
| 19 | New Orleans-Metairie, LA | 78.43 | 20 | 18 | 32 |
| 20 | Nashville-Davidson–Murfreesboro–Franklin, TN | 78.24 | 10 | 36 | 26 |
| 21 | Oklahoma City, OK | 78.11 | 17 | 29 | 24 |
| 22 | Toledo, OH | 77.90 | 30 | 25 | 13 |
| 23 | Huntsville, AL | 77.60 | 19 | 86 | 23 |
| 24 | Louisville/Jefferson County, KY-IN | 77.35 | 14 | 30 | 36 |
| 25 | Charleston-North Charleston, SC | 77.32 | 22 | 38 | 22 |
| 26 | Canton-Massillon, OH | 77.25 | 43 | 8 | 30 |
| 27 | Winston-Salem, NC | 77.20 | 54 | 6 | 9 |
| 28 | Fort Wayne, IN | 77.14 | 15 | 45 | 20 |
| 29 | Dallas-Fort Worth-Arlington, TX | 77.12 | 31 | 20 | 28 |
| 30 | Columbia, SC | 76.84 | 37 | 28 | 16 |
| 31 | Detroit-Warren-Dearborn, MI | 75.97 | 51 | 12 | 21 |
| 32 | El Paso, TX | 75.77 | 24 | 46 | 27 |
| 33 | Lexington-Fayette, KY | 75.41 | 32 | 34 | 34 |
| 34 | Indianapolis-Carmel-Anderson, IN | 74.88 | 25 | 31 | 41 |
| 35 | Greensboro-High Point, NC | 74.72 | 49 | 14 | 38 |
| 36 | Houston-The Woodlands-Sugar Land, TX | 74.60 | 21 | 27 | 78 |
| 37 | Riverside-San Bernardino-Ontario, CA | 74.55 | 46 | 53 | 6 |
| 38 | Youngstown-Warren-Boardman, OH-PA | 74.33 | 50 | 33 | 25 |
| 39 | Charlotte-Concord-Gastonia, NC-SC | 73.72 | 40 | 24 | 51 |
| 40 | Des Moines-West Des Moines, IA | 73.37 | 28 | 70 | 57 |
| 41 | Dayton-Kettering, OH | 73.32 | 38 | 64 | 40 |
| 42 | Richmond, VA | 73.17 | 47 | 47 | 39 |
| 43 | Columbus, OH | 72.90 | 39 | 44 | 48 |
| 44 | Kansas City, MO-KS | 72.77 | 23 | 83 | 42 |
| 45 | St. Louis, MO-IL | 71.96 | 27 | 68 | 61 |
| 46 | Cincinnati, OH-KY-IN | 71.85 | 42 | 32 | 69 |
| 47 | Cleveland-Elyria, OH | 71.50 | 36 | 56 | 66 |
| 48 | Akron, OH | 71.27 | 52 | 72 | 35 |
| 49 | Scranton–Wilkes-Barre, PA | 71.10 | 72 | 35 | 37 |
| 50 | Asheville, NC | 71.02 | 69 | 40 | 46 |
| 51 | Virginia Beach-Norfolk-Newport News, VA-NC | 70.89 | 41 | 43 | 77 |
| 52 | Atlanta-Sandy Springs-Alpharetta, GA | 70.56 | 35 | 55 | 84 |
| 53 | Milwaukee-Waukesha, WI | 70.39 | 44 | 62 | 65 |
| 54 | Las Vegas-Henderson-Paradise, NV | 70.36 | 66 | 22 | 72 |
| 55 | Baltimore-Columbia-Towson, MD | 69.90 | 45 | 50 | 83 |
| 56 | Durham-Chapel Hill, NC | 69.79 | 64 | 63 | 45 |
| 57 | Raleigh-Cary, NC | 69.73 | 59 | 60 | 50 |
| 58 | New Haven-Milford, CT | 69.26 | 71 | 61 | 59 |
| 59 | Orlando-Kissimmee-Sanford, FL | 69.22 | 61 | 39 | 75 |
| 60 | Providence-Warwick, RI-MA | 69.19 | 65 | 73 | 53 |
| 61 | Grand Rapids-Kentwood, MI | 69.19 | 56 | 84 | 55 |
| 62 | Phoenix-Mesa-Chandler, AZ | 69.09 | 75 | 49 | 47 |
| 63 | Reno, NV | 68.67 | 55 | 65 | 68 |
| 64 | Manchester-Nashua, NH | 68.48 | 85 | 42 | 70 |
| 65 | Hartford-East Hartford-Middletown, CT | 68.30 | 68 | 77 | 54 |
| 66 | Allentown-Bethlehem-Easton, PA-NJ | 68.23 | 79 | 69 | 49 |
| 67 | Jacksonville, FL | 68.09 | 58 | 76 | 63 |
| 68 | Austin-Round Rock-Georgetown, TX | 68.03 | 48 | 67 | 86 |
| 68 | Tampa-St. Petersburg-Clearwater, FL | 68.03 | 67 | 48 | 73 |
| 70 | Philadelphia-Camden-Wilmington, PA-NJ-DE-MD | 67.97 | 63 | 37 | 88 |
| 71 | Albuquerque, NM | 67.17 | 53 | 80 | 80 |
| 72 | Anchorage, AK | 66.79 | 57 | 97 | 60 |
| 73 | Pittsburgh, PA | 66.77 | 60 | 81 | 79 |
| 74 | Portland-South Portland, ME | 66.73 | 89 | 66 | 56 |
| 75 | Omaha-Council Bluffs, NE-IA | 66.65 | 78 | 51 | 82 |
| 76 | Spokane-Spokane Valley, WA | 66.54 | 76 | 87 | 52 |
| 77 | Worcester, MA-CT | 66.45 | 87 | 74 | 58 |
| 78 | San Diego-Chula Vista-Carlsbad, CA | 66.15 | 77 | 57 | 87 |
| 79 | Los Angeles-Long Beach-Anaheim, CA | 65.60 | 74 | 82 | 74 |
| 80 | Bridgeport-Stamford-Norwalk, CT | 65.45 | 80 | 91 | 81 |
| 81 | Miami-Fort Lauderdale-Pompano Beach, FL | 65.33 | 70 | 95 | 67 |
| 82 | Ogden-Clearfield, UT | 65.11 | 94 | 58 | 44 |
| 83 | Tucson, AZ | 65.00 | 86 | 54 | 89 |
| 84 | Chicago-Naperville-Elgin, IL-IN-WI | 64.98 | 62 | 79 | 94 |
| 85 | Springfield, MA | 64.94 | 88 | 88 | 64 |
| 86 | Boise City, ID | 64.34 | 91 | 52 | 85 |
| 87 | New York-Newark-Jersey City, NY-NJ-PA | 64.09 | 82 | 59 | 95 |
| 88 | Sacramento-Roseville-Folsom, CA | 62.92 | 73 | 96 | 91 |
| 89 | Provo-Orem, UT | 62.28 | 98 | 92 | 31 |
| 90 | San Francisco-Oakland-Berkeley, CA | 62.24 | 81 | 94 | 92 |
| 91 | Salt Lake City, UT | 62.10 | 97 | 75 | 71 |
| 92 | Colorado Springs, CO | 60.70 | 99 | 78 | 62 |
| 93 | Washington-Arlington-Alexandria, DC-VA-MD-WV | 60.28 | 92 | 71 | 98 |
| 94 | Portland-Vancouver-Hillsboro, OR-WA | 60.11 | 83 | 85 | 99 |
| 95 | Seattle-Tacoma-Bellevue, WA | 59.89 | 84 | 93 | 97 |
| 96 | San Jose-Sunnyvale-Santa Clara, CA | 59.44 | 90 | 100 | 93 |
| 97 | Minneapolis-St. Paul-Bloomington, MN-WI | 58.66 | 93 | 90 | 96 |
| 98 | Boston-Cambridge-Newton, MA-NH | 58.12 | 96 | 99 | 90 |
| 99 | Denver-Aurora-Lakewood, CO | 58.04 | 100 | 98 | 76 |
| 100 | Urban Honolulu, HI | 57.72 | 95 | 89 | 100 |
Note: With the exception of “Total Score,” all of the columns in the table above depict the relative rank of that city, where a rank of 1 represents the worst conditions for that metric category.
While Asheville ranked #50 overall, it was found to have the lowest percentage of obese adults in America.
What do you think about the results?
