 With prices in most areas around the Carolinas reaching new highs almost every week, many have been wondering if our housing market is still healthy.
Today, the financial planning website SmartAsset released its seventh annual study on the Healthiest Housing Markets in North Carolina. The study weighed factors including stability, risk of loss, the ease of selling a home, and home costs as a percentage of local median income.
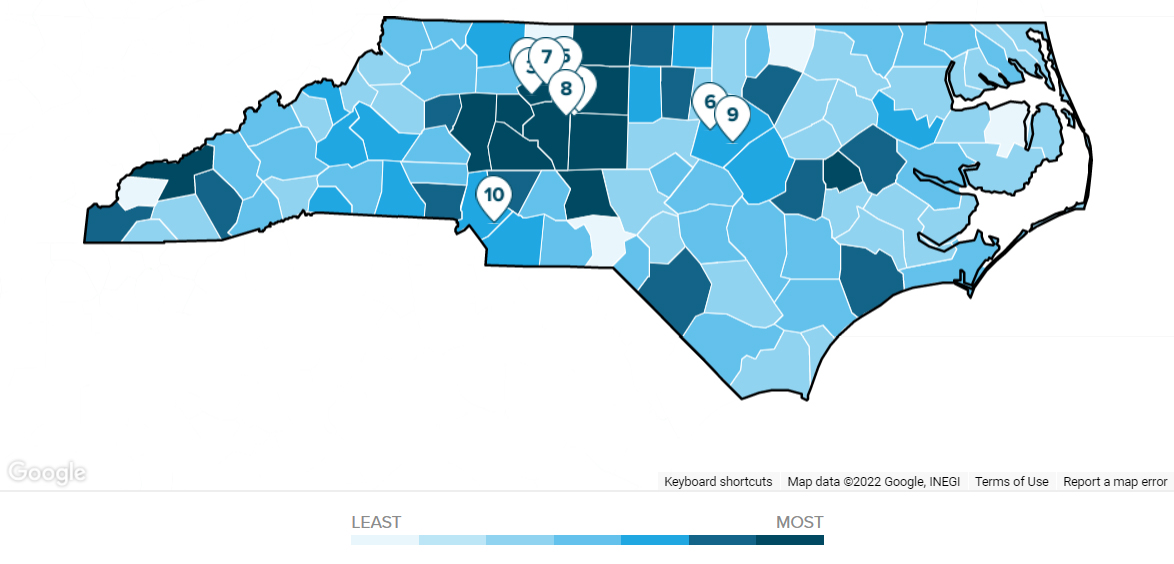
The places that scored the best across these indices were deemed the healthiest housing markets in North Carolina. Most of the top 10 towns centered around the Greensboro area, but Matthews did also make it onto the list with a 79.65 healthy market index score.

| Rank | City, State | Average Years Living in Home | Avg. Homes with Negative Equity | Homes Decreasing in Value | Avg. Days on Market | Home Costs as % of Income | Healthiest Markets Index |
|---|---|---|---|---|---|---|---|
| 1 | Lewisville, NC | 14.3 | 5.3% | 12.1% | 55.7 | 18.1% | 96.69 |
| 2 | Trinity, NC | 15.6 | 5.9% | 12.2% | 56.6 | 18.5% | 96.48 |
| 3 | Clemmons, NC | 11.6 | 5.5% | 12.1% | 55.7 | 17.4% | 93.79 |
| 4 | Archdale, NC | 12.6 | 10.0% | 12.2% | 56.6 | 17.6% | 90.87 |
| 5 | Kernersville, NC | 10.0 | 7.1% | 12.1% | 55.7 | 18.8% | 84.97 |
| 6 | Cary, NC | 9.3 | 5.8% | 13.5% | 56.4 | 16.9% | 84.02 |
| 7 | Winston-Salem, NC | 10.3 | 10.5% | 12.1% | 55.7 | 19.0% | 82.39 |
| 8 | Thomasville, NC | 11.4 | 7.8% | 12.1% | 55.7 | 20.3% | 81.94 |
| 9 | Garner, NC | 10.2 | 6.2% | 13.5% | 56.4 | 18.5% | 79.81 |
| 10 | Matthews, NC | 11.2 | 6.3% | 14.1% | 50.5 | 18.6% | 79.65 |
You can find additional study details, including the methodology and interactive map, on their website here.
