After the pandemic triggered a sharp decline in travel, the industry has steadily regained momentum, with consumer spending on accommodations reaching record highs in 2023 and 2024. Amid this surge in demand, new hotel development has accelerated nationwide—but this growth hasn’t been evenly distributed.
A new analysis of BLS data since 2019 highlights where the sector has expanded most significantly. For travelers, these locations may offer some of the best opportunities to find newly built or recently opened places to stay.
Key Takeaways, With Data for Charlotte-Concord-Gastonia, NC-SC
- Hotel Growth Remains Steady: From 2001 to 2024, the total number of hotel properties grew by more than 33% nationwide, rising from approximately 51,000 to over 68,000 with only a brief slowdown in 2020. And since 2019, the country has seen its hotels increase by 7.3%.
- Employment Recovery Lags Behind: After reaching a high of over 2 million workers in mid-2019, hotel employment fell by more than 50% the following year. As of Q3 2024, the sector employs roughly 1.87 million workers—about 8% below its 2019 peak.
- Michigan & Idaho Lead Nation: Michigan and Idaho led all states in hotel growth since 2019, while New England was the only region with a net decline: Vermont, Massachusetts, and Maine posted losses, and the remaining New England states posted below-average growth. However, Washington and New Mexico saw the steepest declines.
- 96 New Hotels in the Charlotte metro: Between 2019 and 2023 (the most recent year with complete data), the total number of hotels in the Charlotte metro climbed to 496. This 24.0% increase is the 2nd highest of any large U.S. metro. At the same time, hotel employment dropped 6.1%—a loss of about 675 workers.
Trends in U.S. Hotel Growth & Employment
While the number of hotels continues to grow, employment still lags behind pre-pandemic levels
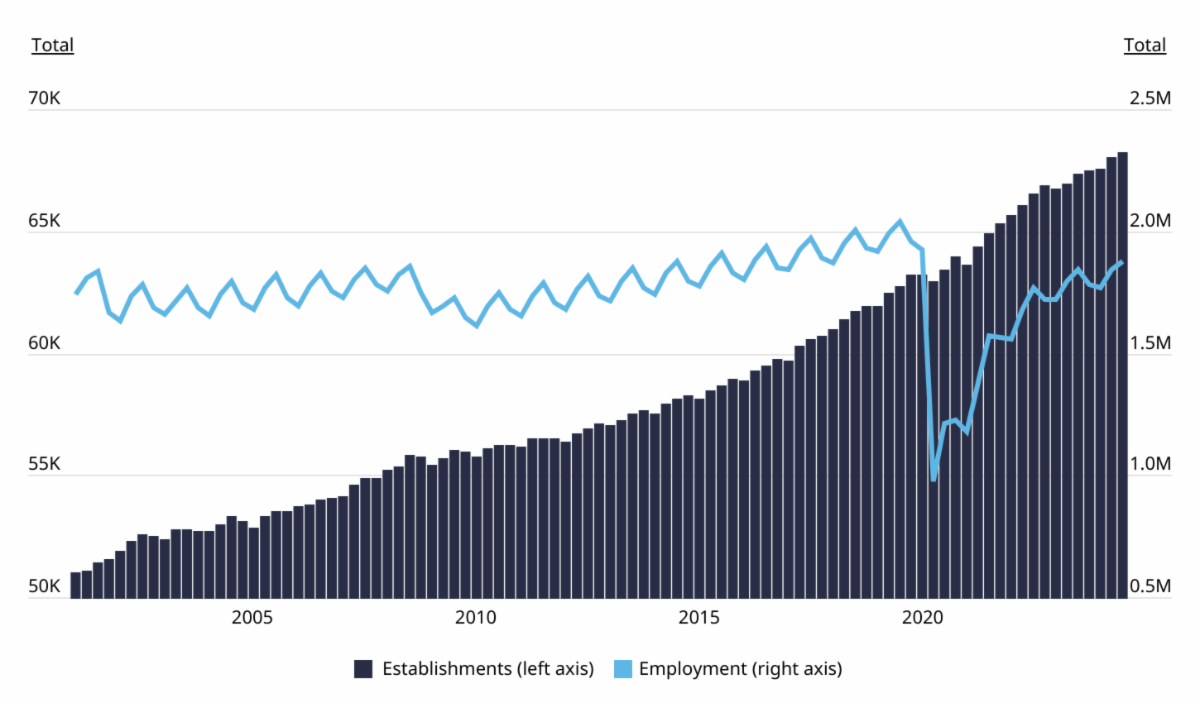
Source: BLS data
Here is the full breakdown of U.S. Cities That Have Added the Most New Hotels
| 1 | Grand Rapids-Wyoming-Kentwood, MI | +32.4% | +35 | 143 | +5.0% | +214 | 4,486 |
| 2 | Charlotte-Concord-Gastonia, NC-SC | +24.0% | +96 | 496 | -6.1% | -676 | 10,465 |
| 3 | Raleigh-Cary, NC | +23.6% | +45 | 236 | +0.5% | +24 | 4,843 |
| 4 | Atlanta-Sandy Springs-Roswell, GA | +22.0% | +212 | 1,174 | -12.3% | -3,186 | 22,744 |
| 5 | Louisville/Jefferson County, KY-IN | +21.7% | +43 | 241 | +0.9% | +51 | 5,877 |
| 6 | Phoenix-Mesa-Chandler, AZ | +19.0% | +87 | 546 | -0.5% | -136 | 25,355 |
| 7 | Tucson, AZ | +18.3% | +23 | 149 | -10.3% | -715 | 6,224 |
| 8 | Jacksonville, FL | +17.6% | +51 | 341 | -11.5% | -1,070 | 8,215 |
| 9 | Tulsa, OK | +17.5% | +31 | 208 | -21.1% | -672 | 2,517 |
| 10 | Orlando-Kissimmee-Sanford, FL | +17.5% | +96 | 645 | -4.9% | -3,196 | 62,224 |
| 11 | Nashville-Davidson–Murfreesboro–Franklin, TN | +16.8% | +75 | 521 | -4.6% | -709 | 14,598 |
| 12 | Denver-Aurora-Centennial, CO | +16.4% | +71 | 503 | -9.8% | -1,829 | 16,820 |
| 13 | Miami-Fort Lauderdale-West Palm Beach, FL | +14.0% | +153 | 1,243 | -11.1% | -6,074 | 48,646 |
| 14 | Tampa-St. Petersburg-Clearwater, FL | +13.6% | +70 | 585 | N/A | N/A | N/A |
| 15 | Dallas-Fort Worth-Arlington, TX | +12.8% | +159 | 1,398 | -1.9% | -650 | 33,628 |
| 16 | Cincinnati, OH-KY-IN | +12.6% | +35 | 313 | +7.0% | +462 | 7,075 |
| 17 | Austin-Round Rock-San Marcos, TX | +12.1% | +49 | 453 | N/A | N/A | N/A |
| 18 | Washington-Arlington-Alexandria, DC-VA-MD-WV | +11.7% | +92 | 877 | -19.1% | -8,668 | 36,628 |
| 19 | Portland-Vancouver-Hillsboro, OR-WA | +11.6% | +41 | 393 | N/A | N/A | N/A |
| 20 | Birmingham, AL | +10.8% | +21 | 215 | -14.6% | -584 | 3,426 |
| 21 | Oklahoma City, OK | +10.7% | +31 | 320 | +1.0% | +52 | 5,509 |
| 22 | Detroit-Warren-Dearborn, MI | +10.5% | +47 | 493 | -25.6% | -4,759 | 13,813 |
| 23 | Richmond, VA | +10.2% | +25 | 270 | -14.4% | -854 | 5,095 |
| 24 | Sacramento-Roseville-Folsom, CA | +9.8% | +31 | 346 | -10.1% | -982 | 8,744 |
| 25 | Riverside-San Bernardino-Ontario, CA | +9.8% | +54 | 603 | -6.7% | -1,138 | 15,930 |
| 26 | Cleveland-Elyria, OH | +9.6% | +20 | 228 | N/A | N/A | N/A |
| 27 | Memphis, TN-MS-AR | +9.5% | +31 | 357 | -32.2% | -3,507 | 7,389 |
| 28 | New York-Newark-Jersey City, NY-NJ | +8.8% | +175 | 2,171 | N/A | N/A | N/A |
| 29 | Buffalo-Cheektowaga, NY | +8.4% | +15 | 193 | -19.2% | -975 | 4,112 |
| 30 | Virginia Beach-Chesapeake-Norfolk, VA-NC | +8.4% | +32 | 414 | -11.3% | -1,224 | 9,602 |
| 31 | Los Angeles-Long Beach-Anaheim, CA | +8.3% | +145 | 1,896 | -8.1% | -6,142 | 69,303 |
| 32 | Houston-Pasadena-The Woodlands, TX | +8.0% | +101 | 1,365 | N/A | N/A | N/A |
| 33 | Minneapolis-St. Paul-Bloomington, MN-WI | +7.4% | +29 | 423 | -14.3% | -2,057 | 12,332 |
| 34 | Columbus, OH | +6.9% | +22 | 341 | -8.3% | -665 | 7,351 |
| 35 | Kansas City, MO-KS | +6.5% | +20 | 327 | -11.7% | -1,147 | 8,649 |
| 36 | Indianapolis-Carmel-Greenwood, IN | +6.2% | +20 | 343 | -11.4% | -969 | 7,499 |
| 37 | Salt Lake City-Murray, UT | +5.9% | +12 | 217 | N/A | N/A | N/A |
| 38 | Milwaukee-Waukesha, WI | +5.4% | +9 | 176 | N/A | N/A | N/A |
| 39 | Pittsburgh, PA | +4.4% | +12 | 287 | N/A | N/A | N/A |
| 40 | Providence-Warwick, RI-MA | +3.8% | +9 | 244 | N/A | N/A | 6,630 |
| 41 | San Antonio-New Braunfels, TX | +3.7% | +19 | 527 | N/A | N/A | N/A |
| 42 | Baltimore-Columbia-Towson, MD | +3.7% | +11 | 306 | -19.8% | -2,322 | 9,427 |
| 43 | Philadelphia-Camden-Wilmington, PA-NJ-DE-MD | +3.6% | +19 | 543 | N/A | N/A | N/A |
| 44 | San Diego-Chula Vista-Carlsbad, CA | +3.6% | +19 | 545 | -8.6% | -2,690 | 28,554 |
| 45 | San Jose-Sunnyvale-Santa Clara, CA | +2.5% | +7 | 287 | -19.9% | -1,821 | 7,347 |
| 46 | Boston-Cambridge-Newton, MA-NH | +2.2% | +12 | 552 | N/A | N/A | 24,489 |
| 47 | Fresno, CA | +2.0% | +2 | 104 | -15.2% | -343 | 1,914 |
| 48 | St. Louis, MO-IL | +1.6% | +6 | 384 | -19.5% | -2,833 | 11,691 |
| 49 | Rochester, NY | +1.6% | +2 | 130 | -2.5% | -59 | 2,321 |
| 50 | San Francisco-Oakland-Fremont, CA | +0.9% | +7 | 780 | -31.6% | -11,310 | 24,492 |
| 51 | Chicago-Naperville-Elgin, IL-IN | -0.4% | -4 | 947 | -15.8% | -6,644 | 35,535 |
| 52 | Las Vegas-Henderson-North Las Vegas, NV | -3.1% | -10 | 312 | -15.9% | -25,989 | 137,083 |
| 53 | Hartford-West Hartford-East Hartford, CT | -4.8% | -7 | 138 | -23.1% | -904 | 3,014 |
| 54 | Seattle-Tacoma-Bellevue, WA | -6.2% | -31 | 469 | -14.9% | -2,752 | 15,698 |

 Learning to drive and earning a license are major milestones for Richmond teens. While the experience is usually exciting for kids, it can be nerve-wracking for parents. From navigating I-95 traffic to handling hectic school drop-off lines and unpredictable weather, there’s a lot your teen needs to master before driving solo.
 The 2025 Keep Pounding Classic will return to

 Mason’s Famous Lobster Rolls
 Taxpayers in North and South Carolina now have until May 1, 2025, to file their federal and state tax returns, following deadline extensions granted in response to Hurricane Helene.
 TMSA Public Charter Schools has received an $8.28 million federal grant from the U.S. Department of Education to expand access to STEAM-focused education across North Carolina. The competitive five-year Charter Schools Program (CSP) grant will support the launch of three new campuses and add 3,740 student seats in Wake, Guilford, Mecklenburg, and Cabarrus counties.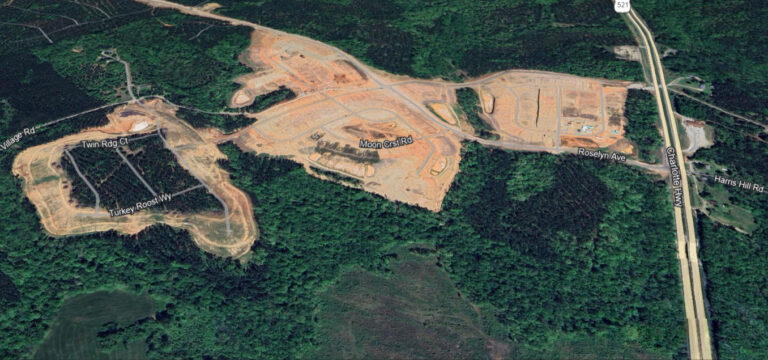
 Lennar has just announced the grand opening of its massive new 1,475 acre project in Lancaster.
 Charlotte-based