Charlotte Joins Nationwide Protests on Flag Day to Push Back Against Trump Administration

0

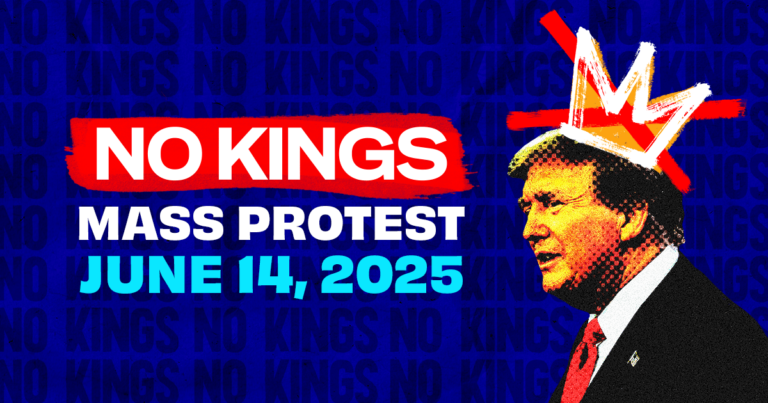
A large protest is set to take place in Charlotte on Saturday, June 14, as part of a nationwide day of action organized by progressive advocacy groups.

Indivisible Charlotte will lead the local ‘No Kings‘ demonstration in Charlotte, joined by organizations including the Charlotte Women’s March, the Carolina Migrant Network, TLC in CLT, and the American Federation of Teachers.

The protest coincides with Flag Day and President Donald Trump’s birthday, which organizers say was a deliberate choice. They describe the event as a peaceful response to what they see as federal overreach and rising authoritarianism, including recent actions by Trump and his supporters. Nationally, more than 1,600 demonstrations are planned, with thousands expected to gather in Charlotte alone.

In South Carolina, Attorney General Alan Wilson issued a public warning, accusing unnamed groups of promoting anti-American rhetoric and urging law enforcement to prepare for possible disruptions.

Law enforcement agencies across the Carolinas plan to increase patrols throughout the weekend.

NOAA Predicts Above-Normal 2025 Hurricane Season, Carolina Coastal Counties Among Most at Risk

0

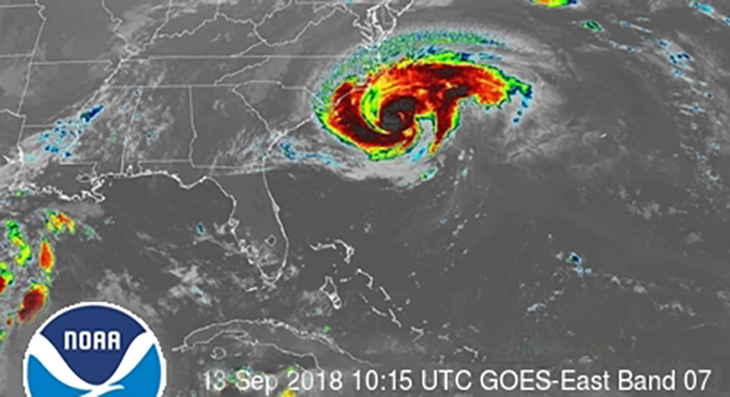
The Atlantic hurricane season began June 1, and federal officials are warning of another above-normal year. The National Oceanic and Atmospheric Administration (NOAA) projects up to 19 named storms and as many as five major hurricanes in its 2025 outlook, which extends through November 30.
Coastal communities in the Carolinas face heightened risk, particularly South Carolina’s Grand Strand. According to a new report by LawnStarter, several counties along the Carolina coast rank among the most hurricane-affected in the nation. The study analyzed 318 FEMA-designated counties using 10 storm-related metrics, including historical damage, financial vulnerability, and recovery capacity.

The report noted that more than half of the hurricanes striking Carolina counties in the past decade reached Category 3 or higher. Charleston County ranked third most vulnerable in the U.S., followed closely by Horry County at No. 4 and Beaufort County at No. 5. North Carolina counties Onslow and New Hanover placed ninth and twelfth.

Mecklenburg County ranked 166th, just behind Lancaster County, PA (164th) and Portsmouth City, VA (165th), and just ahead of Acadia Parish, LA (167th) and St. Bernard Parish, LA (168th).

2025’s Most (& Least) Affected Counties by Hurricanes

1 Broward County FL 72.95 3 42 2 248
2 Palm Beach County FL 72.12 4 42 3 267
3 Charleston County SC 69.97 9 2 8 267
4 Horry County SC 68.33 11 2 11 211
5 Beaufort County SC 67.05 21 2 18 185
6 Miami-Dade County FL 65.30 2 104 4 288
7 Chatham County GA 64.92 13 17 12 259
8 Berkeley County SC 64.77 32 2 31 223
9 Onslow County NC 63.62 23 17 20 65
10 Dorchester County SC 63.13 46 2 47 193
11 Georgetown County SC 61.86 60 2 56 203
12 New Hanover County NC 61.02 15 32 13 155
13 Brevard County FL 60.38 7 61 7 203
14 Florence County SC 58.47 99 2 103 131
15 Carteret County NC 58.12 33 32 26 65
16 Harris County TX 57.95 1 266 1 318
17 Brunswick County NC 57.76 37 32 27 22
18 Pender County NC 57.58 76 17 79 65
19 Columbus County NC 57.18 115 2 134 131
20 Bladen County NC 57.12 117 2 132 22
21 Pasco County FL 56.94 10 73 14 203
22 Duplin County NC 56.82 83 17 96 107
23 Orange County FL 56.51 22 50 24 257
24 Jasper County SC 56.43 126 2 147 107
25 Hillsborough County FL 56.41 5 131 5 257
26 Craven County NC 56.39 44 32 46 175
27 Robeson County NC 56.05 88 24 105 22
28 St. Lucie County FL 55.68 20 64 21 131
29 Dare County NC 55.52 55 32 51 65
30 Colleton County SC 55.36 142 2 153 65
31 Collier County FL 55.26 12 104 10 155
32 Orangeburg County SC 54.89 108 17 116 155
33 Volusia County FL 54.41 41 50 41 203
34 Beaufort County NC 54.15 66 32 77 65
35 Sampson County NC 53.97 78 26 97 107
36 Polk County FL 53.74 31 62 38 203
37 Pitt County NC 53.69 84 26 90 107
38 Williamsburg County SC 53.61 166 2 203 107
39 Dillon County SC 53.61 121 24 145 65
40 Pinellas County FL 53.49 8 131 9 238
41 Duval County FL 53.02 28 78 29 248
42 Wayne County NC 52.96 91 26 99 185
43 Martin County FL 52.95 42 64 39 107
44 Monroe County FL 52.77 47 58 52 131
45 Marion County SC 52.56 181 2 216 107
46 Lee County FL 52.09 6 217 6 223
47 Lenoir County NC 51.93 105 26 125 107
48 St. Johns County FL 51.79 90 44 73 131
49 Clarendon County SC 51.63 195 2 224 65
50 Lafayette Parish LA 51.45 53 66 53 155
51 Manatee County FL 51.42 19 131 19 131
52 Indian River County FL 51.21 35 111 31 65
53 Liberty County GA 51.08 70 56 80 131
54 Osceola County FL 50.66 81 50 91 65
55 Citrus County FL 49.77 51 88 54 155
56 Cumberland County NC 49.67 135 26 155 203
57 Terrebonne Parish LA 49.62 48 100 48 131
58 Marion County FL 49.55 62 78 67 193
59 St. Mary Parish LA 49.40 74 66 83 65
60 East Baton Rouge Parish LA 48.96 54 100 50 211
61 Sarasota County FL 48.79 16 217 16 175
62 Bryan County GA 48.69 139 32 128 65
63 Jefferson Parish LA 48.45 24 176 22 193
64 Hernando County FL 48.34 56 112 65 131
65 Lake County FL 48.20 79 81 82 107
66 Bay County FL 48.17 29 138 33 65
67 Seminole County FL 48.06 71 86 68 185
68 Putnam County FL 47.92 123 47 156 22
69 Jones County NC 47.71 211 17 245 22
70 Tangipahoa Parish LA 47.53 68 100 76 131
71 Clay County FL 47.34 148 44 131 22
72 Honolulu County HI 47.17 259 1 249 314
73 Baldwin County AL 47.02 26 215 23 193
74 Livingston Parish LA 46.80 80 100 72 22
75 Orleans Parish LA 46.73 36 176 35 185
76 Lafourche Parish LA 46.71 72 115 74 1
77 Pamlico County NC 46.71 167 32 161 22
78 Iberia Parish LA 46.42 112 66 118 65
79 Alachua County FL 46.19 92 88 92 131
80 Okaloosa County FL 46.17 30 215 28 131
81 Escambia County FL 46.06 25 224 25 175
82 Hendry County FL 45.65 125 62 183 131
83 Ocean County NJ 45.28 104 84 95 267
84 Hampton County SC 44.76 254 17 267 65
85 Glynn County GA 44.67 111 88 107 175
86 Charlotte County FL 44.65 43 217 44 65
87 Kings County NY 44.65 50 139 63 296
88 Hyde County NC 44.53 198 32 212 1
89 St. Tammany Parish LA 44.26 49 212 45 65
90 Sumter County SC 44.19 213 26 222 228
91 Richland County SC 44.17 154 58 149 219
92 Moore County NC 44.09 272 16 259 107
93 Tattnall County GA 44.00 190 46 217 65
94 Ascension Parish LA 43.96 73 139 66 107
95 Chesapeake City VA 43.84 116 94 98 238
96 Harrison County MS 43.81 40 229 40 230
97 Bulloch County GA 43.57 136 82 138 155
98 Norfolk City VA 43.54 119 94 119 223
99 Queens County NY 43.49 63 139 69 296
100 Nassau County NY 43.41 64 139 55 313
101 Mobile County AL 43.41 14 267 15 270
102 Wake County NC 43.28 130 85 108 277
103 DeSoto County FL 43.08 109 122 142 65
104 Suffolk County NY 42.81 45 139 36 317
105 New York County NY 42.59 75 180 75 155
106 Leon County FL 42.53 85 152 81 155
107 Sussex County DE 42.43 110 127 101 193
108 Santa Rosa County FL 42.20 61 224 61 107
109 Jackson County MS 42.18 57 229 57 193
110 Highlands County FL 42.10 128 116 136 155
111 St. Martin Parish LA 42.07 174 66 175 22
112 Flagler County FL 42.04 151 86 140 22
113 Sumter County FL 41.75 141 112 117 175
114 Covington County AL 41.67 133 119 133 175
115 Accomack County VA 41.47 137 118 146 65
116 Hertford County NC 41.46 214 48 244 65
117 Effingham County GA 41.34 245 32 223 22
118 Vermilion Parish LA 41.29 185 66 191 65
119 Baltimore County MD 41.24 82 202 70 230
120 Brazoria County TX 41.09 34 258 34 238
121 Prince George’s County MD 40.92 87 163 86 295
122 St. Landry Parish LA 40.89 191 66 200 22
123 Monmouth County NJ 40.83 95 139 84 307
124 Galveston County TX 40.80 38 258 37 230
125 Montgomery County MD 40.70 86 202 78 259
126 Coffee County AL 40.52 140 124 144 65
127 Camden County GA 40.22 175 88 166 22
128 Wilson County NC 40.03 228 50 242 185
129 Greene County NC 39.91 231 50 269 22
130 Washington County NC 39.78 171 104 211 1
131 Jefferson County TX 39.67 52 251 58 238
132 Philadelphia County PA 39.47 103 180 114 284
133 Atlantic County NJ 39.41 120 148 124 278
134 Calcasieu Parish LA 39.37 58 251 59 211
135 Virginia Beach City VA 39.34 180 94 156 211
136 Wicomico County MD 39.08 157 127 159 107
137 Iberville Parish LA 39.02 218 66 221 22
138 Walton County FL 38.94 65 254 62 22
139 Middlesex County NJ 38.92 107 180 100 303
140 Okeechobee County FL 38.91 158 130 188 22
141 Nassau County FL 38.67 212 78 186 65
142 Fairfax County VA 38.54 69 242 60 263
143 Escambia County AL 38.47 102 224 115 155
144 Lexington County SC 38.14 224 73 206 252
145 Washington Parish LA 38.14 122 202 139 22
146 Newport News City VA 38.08 132 191 130 185
147 Worcester County MD 38.01 173 127 168 65
148 Chesterfield County VA 37.71 143 163 123 131
149 Pearl River County MS 37.55 114 229 111 22
150 Johnston County NC 37.55 265 50 270 155
151 Bertie County NC 37.13 209 104 247 22
152 Houston County AL 37.13 145 196 152 155
153 Martin County NC 37.09 210 104 231 22
154 Nash County NC 36.62 270 57 286 155
155 Assumption Parish LA 36.60 169 139 187 1
156 Halifax County NC 36.56 285 48 309 131
157 Montgomery County PA 36.26 156 180 121 254
158 Thomas County GA 36.23 168 152 195 185
159 Suffolk City VA 36.12 229 94 201 65
160 Chesterfield County SC 35.92 276 58 297 1
161 Harnett County NC 35.90 227 104 239 107
162 Middlesex County MA 35.88 59 268 49 316
163 Fort Bend County TX 35.77 18 315 17 223
164 Lancaster County PA 35.69 153 202 135 250
165 Portsmouth City VA 35.54 236 94 233 131
166 Mecklenburg County NC 35.51 253 77 235 281
167 Acadia Parish LA 35.38 155 220 164 22
168 St. Bernard Parish LA 35.35 176 176 182 1
169 Nantucket County MA 35.33 160 213 122 107
170 Hudson County NJ 35.13 165 180 181 283
171 Pasquotank County NC 35.11 189 150 194 22
172 Baltimore City MD 35.09 101 242 104 290
173 Appling County GA 34.96 275 73 292 65
174 Wayne County GA 34.85 252 88 262 22
175 Burlington County NJ 34.83 187 139 150 278
176 Jackson County FL 34.75 179 196 207 107
177 Hampton City VA 34.65 182 191 178 131
178 George County MS 34.60 144 235 162 1
179 Cape May County NJ 34.36 199 148 170 219
180 Jefferson Davis Parish LA 34.32 170 220 189 22
181 Hidalgo County TX 34.18 17 303 30 264
182 Fairfield County CT 34.17 67 278 64 290
183 Aiken County SC 34.11 283 73 283 245
184 Bucks County PA 34.08 188 180 151 245
185 Mercer County NJ 34.07 184 180 163 270
186 Hancock County MS 34.06 164 229 143 1
187 Hardee County FL 34.04 240 122 268 22
188 Tyrrell County NC 33.88 257 104 282 1
189 Columbia County FL 33.77 205 152 232 65
190 Orange County TX 33.74 129 251 127 107
191 Suwannee County FL 33.73 206 152 225 22
192 Levy County FL 33.65 207 152 237 22
193 Colquitt County GA 33.64 244 120 271 193
194 Anne Arundel County MD 33.53 131 242 102 264
195 Cameron County TX 33.19 27 303 42 230
196 Richmond County NY 33.01 201 180 197 254
197 Chester County PA 32.92 196 202 154 219
198 New Haven County CT 32.81 77 278 71 307
199 McIntosh County GA 32.77 221 152 214 1
200 Coffee County GA 32.73 258 120 278 175
201 St. Mary’s County MD 32.63 215 163 196 155
202 Delaware County PA 32.58 202 202 177 155
203 Northampton County VA 32.54 280 94 291 65
204 St. Charles Parish LA 32.43 177 233 158 22
205 Nueces County TX 32.38 39 303 43 230
206 Worcester County MA 32.24 100 268 94 315
207 Washington County FL 32.20 149 254 176 1
208 Cumberland County NJ 32.20 216 163 227 250
209 Essex County MA 32.19 96 274 89 312
210 Bristol County MA 31.94 124 264 110 305
211 Bronx County NY 31.88 89 278 113 290
212 York County VA 31.88 223 191 185 131
213 Westchester County NY 31.82 93 278 88 298
214 St. John the Baptist Parish LA 31.79 186 233 173 22
215 Glades County FL 31.68 279 116 310 65
216 Kent County DE 31.59 230 163 235 107
217 Montgomery County TX 31.48 94 297 87 254
218 Liberty County TX 31.38 150 258 184 155
219 Union County NJ 31.37 222 180 215 276
220 Ware County GA 31.36 303 88 298 65
221 Plaquemines Parish LA 31.28 235 176 220 22
222 York County PA 31.25 220 202 199 203
223 Lowndes County GA 31.24 239 152 240 228
224 Norfolk County MA 31.20 97 278 85 310
225 Bergen County NJ 31.19 98 278 93 305
226 Plymouth County MA 31.13 134 264 106 310
227 Evans County GA 31.13 317 82 318 65
228 Somerset County NJ 31.08 232 180 198 230
229 Suffolk County MA 31.01 113 278 109 223
230 Pierce County GA 30.99 297 112 296 1
231 Stone County MS 30.95 197 235 204 1
232 Chambers County TX 30.81 159 258 148 193
233 Decatur County GA 30.67 238 196 256 131
234 James City County VA 30.63 242 191 213 1
235 Durham County NC 30.59 267 135 258 211
236 Harford County MD 30.13 237 202 202 193
237 Guilford County NC 30.05 262 137 260 245
238 Matagorda County TX 30.04 118 296 129 65
239 Berks County PA 29.93 248 180 229 230
240 Nacogdoches County TX 29.93 172 258 192 107
241 St. James Parish LA 29.92 266 139 257 22
242 Washington County RI 29.79 289 126 253 238
243 Taylor County FL 29.78 264 152 278 1
244 Richmond County GA 29.51 291 131 300 175
245 Grady County GA 29.49 255 196 277 155
246 New Castle County DE 29.45 192 242 169 211
247 Jones County MS 29.36 219 235 218 131
248 Pike County MS 29.27 299 125 306 155
249 Franklin County FL 28.96 290 136 301 22
250 Hartford County CT 28.91 127 278 112 309
251 Dorchester County MD 28.83 271 163 273 1
252 Prince William County VA 28.63 204 242 179 211
253 Gulf County FL 28.46 247 223 246 22
254 Holmes County FL 28.42 203 254 230 65
255 Forrest County MS 28.29 234 235 241 155
256 Rapides Parish LA 28.27 246 227 252 107
257 Camden County NJ 28.23 200 242 193 285
258 Caroline County MD 28.08 281 163 289 107
259 Charles County MD 27.99 282 163 254 175
260 Chowan County NC 27.97 292 150 302 107
261 Howard County MD 27.72 269 202 243 243
262 Somerset County MD 27.62 288 163 293 65
263 Providence County RI 27.58 147 278 141 303
264 Madison County FL 27.43 298 152 307 22
265 Dougherty County GA 27.18 287 196 299 219
266 New London County CT 27.16 163 278 137 270
267 Essex County NJ 27.13 162 278 171 270
268 Hillsborough County NH 26.94 193 268 160 288
269 Bradford County FL 26.77 308 152 313 1
270 Henrico County VA 26.73 301 163 274 131
271 Talbot County MD 26.71 302 163 272 65
272 Hamilton County FL 26.67 309 152 317 22
273 Victoria County TX 26.53 106 303 120 175
274 Gadsden County FL 26.31 263 241 295 65
275 Isle of Wight County VA 26.25 305 191 285 22
276 Marion County MS 26.02 293 214 305 22
277 Lamar County MS 26.01 268 235 265 107
278 Tift County GA 25.96 307 196 303 155
279 Stafford County VA 25.86 313 163 275 185
280 Barnstable County MA 25.77 161 299 126 286
281 Westmoreland County VA 25.61 318 163 304 22
282 District of Columbia DC 25.21 249 242 238 259
283 Loudoun County VA 24.92 312 202 265 211
284 Dale County AL 24.81 256 254 264 65
285 Evangeline Parish LA 24.31 316 220 316 1
286 Wharton County TX 24.07 138 315 172 131
287 Avoyelles Parish LA 23.88 311 227 315 1
288 Hampden County MA 23.87 233 268 226 301
289 San Patricio County TX 23.75 146 303 167 65
290 Morris County NJ 23.68 208 278 165 290
291 Gloucester County NJ 23.52 273 242 247 264
292 Litchfield County CT 23.42 217 278 180 270
293 Jackson County TX 23.36 152 303 174 22
294 Arlington County VA 23.24 284 242 251 131
295 Rockingham County NH 22.96 250 268 205 290
296 Choctaw County AL 22.87 314 235 314 65
297 Passaic County NJ 22.65 226 278 228 278
298 Middlesex County CT 21.53 260 274 234 262
299 Kleberg County TX 21.51 178 303 210 65
300 Polk County TX 21.44 295 258 311 131
301 Jim Wells County TX 21.18 183 303 209 65
302 Rockland County NY 20.50 261 278 250 252
303 Calhoun County TX 20.48 194 303 208 1
304 Clarke County AL 19.52 300 273 307 107
305 Cumberland County ME 19.31 225 302 190 301
306 Kent County RI 18.92 286 278 261 230
307 York County ME 18.84 251 300 219 300
308 Windham County CT 18.66 304 274 284 243
309 Dutchess County NY 18.66 296 274 275 286
310 Orange County NY 17.98 294 278 281 281
311 Bee County TX 17.22 241 303 262 1
312 Lehigh County PA 17.04 315 278 294 203
313 Willacy County TX 17.04 243 303 287 22
314 Dauphin County PA 16.50 310 297 290 193
315 Bexar County TX 16.19 277 301 288 299
316 Aransas County TX 14.97 274 303 280 22
317 DeWitt County TX 12.60 306 315 312 22
318 Kennebec County ME 8.45 278 318 255 270

During this hurricane season, North Carolina is introducing Know Your Zone, a tiered evacuation system that highlights areas most vulnerable to storm surge from hurricanes and tropical storms, and other hazards. If it becomes necessary, local officials will order evacuations using pre-determined zones created by coastal counties. The Know Your Zone lookup tool is a new color-coded interactive map you can use to determine the evacuation zone where you live, work, or are visiting based upon street address.

During this time, officials are also recommending that all North Carolina residents prepare for possible power outages from hurricane damage. The following emergency items are suggested for all homes in our our state;

NC Senate Passes Immigration Bill Requiring NC Police Cooperation with ICE

0

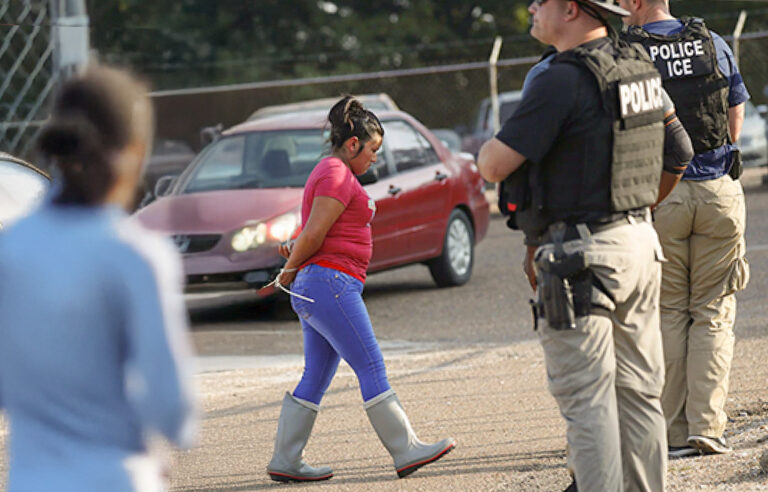
The North Carolina Senate approved legislation Tuesday requiring all county sheriffs to cooperate with federal immigration officials. The House Bill 318, also known as the Criminal Illegal Alien Enforcement Act, now heads to Governor Josh Stein to be signed or vetoed.


HB 318 mandates that local law enforcement notify U.S. Immigration and Customs Enforcement (ICE) when detainees are about to be released. It expands prior requirements to include all felony charges and Class A1 misdemeanors.

Under the bill, jail staff must bring individuals with ICE detainers before a judge, who could order them held up to 48 hours. Judges would also be required to evaluate immigration status during pretrial hearings.

Senator Thom Tillis’ office says ten North Carolina counties, including Mecklenburg and Watauga, do not currently cooperate with ICE. The law would take effect October 1, 2025, if signed.

What Really Happens at the MLB Trade Deadline?

0

There’s just something unique about being halfway through the MLB season. The games are coming in fast, playoff hopes are becoming real (or fading away), and front offices are racing the clock as the trade deadline nears. And at this point, speculation is about to get to an all-time high, with MLB trade rumors starting to flood every corner of the sports world.

At the center of all this is the MLB trade deadline. For some teams, it’s a chance to go all out and give themselves the best opportunity for the playoffs. For others, it’s time to look at the future and plan for what comes next. 

But what actually goes on in the trade deadline, and what’s its significance? That’s what we’ll walk you through today.

What Exactly is the MLB Trade Deadline?

Since November, MLB teams are usually free to build their rosters before the season starts in March. After the start of the season, the window remains open, although this period is mostly defined by calculated moves that aim to strengthen a team, for example, in case of a major injury.

But now, we are heading towards July 31st, when the trade season closes. After this day, teams will no longer be allowed to trade players within their 40-man roster. This means that every team will be trying to make a move before the deadline, regardless of the intention.

What’s the Significance of the Trade Deadline?

In the MLB, the trade deadline isn’t just a date, but a defining moment. You see, in the first half of the season, teams have been assessing their rosters, so they know their weaknesses and strengths. While they can make trades at any point during this first part, the second part is restricted by the trade deadline. If you don’t make the roster changes you need, you’ll have to cope with the second half of the season and the postseason.

This means that before the deadline, every team, whether it’s winning or losing, needs to confront its situation and act fast. 

The trade deadline also gives us one of the most defining moments of the season, as the tone tends to shift. The rumor mill hits overdrive, fans pay more attention, and front offices feel the heat of making something happen. 

Even more than the trades, it tells a story about the club. Whether there’s a big move, a small one, or nothing, fans will know where their team stands.

Buyers vs. Sellers: Two Very Different Strategies

As the trade deadline nears, every team has a decision to make – are we trying to win now, or do we need to plan for the future? That brings in the classic split between buyers and sellers.

Buyers are the teams that are hunting or strengthening for the playoffs. They’ve spotted a weakness and are willing to give up talent to fix it for immediate gains.

On the other hand, sellers are usually the teams that aren’t chasing the playoffs that year. Instead, they need to focus on the bigger picture and plan for the future. This makes it possible for them to trade experienced players, especially those with contracts expiring soon, in exchange for younger talent. For these teams, the trade deadline is a chance to reset and build towards the future.

Both strategies typically work well – it only depends on where a team is in its development cycle. The teams caught in the middle create some of the most interesting stories as they have to make a tough call whether they are a buyer or a seller.

When’s the 2025 MLB Trade Deadline

This year, the MLB trade deadline falls on Thursday, July 31, at 6 p.m. Eastern Time. Even though the league now has some flexibility with the date, it decided to stick with the traditional one for 2025.

For fans who like reading baseball rumors, the weeks and days leading up to that date are the peak of the action.

What Should You Look for in a Dumpster Rental Provider for Renovation Projects?

0

When you’re fixing up your home or business, you’ll end up with a lot of waste. Getting rid of all that stuff easily means picking the right dumpster rental company. A good company will tell you their prices clearly, let you keep the dumpster for as long as you need, and be quick to help if you have questions. Whether you’re a homeowner doing a small update or a business needing dumpster rentals for Utah businesses, knowing what to expect can stop you from having expensive surprises.

The best companies help you assess the right size for your needs, communicate clear rental terms, and prioritize both safe placement and timely pickup. Paying attention to these details saves time, reduces unexpected hassles, and ensures you comply with local regulations.

Key Takeaways

  • Consider clear pricing and rental period flexibility
  • Check safety practices and service responsiveness
  • Assess provider’s ability to match your project’s logistics

Essential Factors to Consider When Choosing a Dumpster Rental Provider

Selecting the right dumpster rental provider for a renovation project requires attention to several important aspects. The choice impacts budget, efficiency, and how responsibly renovation waste is handled.

Evaluating Dumpster Sizes and Capacity Options

Finding a suitable dumpster size can prevent unnecessary expenses and delays. Providers typically offer various options, such as 10-yard, 20-yard, 30-yard, and 40-yard dumpsters, each designed for different volumes of construction debris from small home improvement to large-scale home renovations. Estimating the amount and type of waste that the project will generate is key. For example, a small dumpster might fit a minor home renovation, while larger renovations often require a 20-yard or 30-yard dumpster for mixed renovation waste and heavier materials.

Weight capacity and limits are crucial when renting a dumpster. Overloading beyond the specified weight can result in extra charges. Some companies help determine the best size for the project’s scope to ensure cost-effective waste removal.

Understanding Rental Terms and Costs

Comparing prices between rental companies is essential. Dumpster rental costs can vary depending on size, rental duration, and the type of renovation waste. Many rental companies offer a flat fee for a specific period, such as a week or ten days, but extra costs may apply if the dumpster is kept longer, is overloaded, or contains hazardous materials.

Understanding the pricing structure avoids hidden fees and helps maintain a project budget. Key factors influencing rental costs include the length of the rental period, project timeline changes, and the amount or type of construction debris.

Assessing Waste Disposal Practices and Environmental Responsibility

A responsible dumpster rental provider should follow safe waste disposal methods and prioritize environmental responsibility. Companies with clear policies on recycling materials and eco-friendly waste disposal help divert renovation waste from landfills, supporting better waste management practices.

Look for rental providers that offer recycling options for wood, metal, and other materials common in home improvement and renovation waste. According to the EPA’s Construction and Demolition Materials guidance, construction and demolition materials comprise debris generated during the construction, renovation, and demolition of buildings. Sustainable management practices can significantly reduce the environmental impact of these materials. Transparent disposal methods, proper handling of hazardous items, and a commitment to eco-friendly disposal reflect a provider’s dedication to the environment.

Logistics, Safety, and Service Quality in Dumpster Rentals

Choosing the right dumpster rental company shapes the efficiency and safety of renovation and cleanup projects. Homeowners and contractors must consider rules, site safety, and the reliability of customer support to avoid costly delays or problems.

Understanding Local Regulations and Permit Requirements

Before renting a dumpster for home renovation, it is important to check local bylaws and permit rules. Regulations may differ between cities, neighbourhoods, or even homeowner associations. Many municipalities require permits if the bin will be placed on a public street or sidewalk.

Property owners should always confirm the dumpster’s planned location complies with legal requirements. Failing to obtain the correct permits may result in fines, project delays, or removal of the container. It is also good practice to ask the provider about local restrictions on certain waste types, such as hazardous materials. Not all renovation debris—especially from bathroom remodels—can be tossed in a standard bin.

Ensuring Safe Placement and Loading Techniques

A safe, organized workspace begins with correct dumpster placement. Make sure the bin is set on level, firm ground close to the work area but not blocking access or exits. Keep children and pets away from the dumpster at all times, as large bins can be tempting but dangerous, especially during cleanup projects.

Efficient loading techniques prevent shifting, overfilling, and accidents. Distribute waste evenly, with heavier materials at the bottom. Hazardous waste, electronics, and certain construction debris should be kept out of general bins. For projects such as kitchen remodels or garage cleanouts, scheduling regular pickups can help maintain safety and an organized worksite.

Conclusion

Selecting a dumpster rental provider for renovation projects requires attention to several important factors. Size options, clear pricing, flexible rental periods, and reliable delivery and pick-up services are all essential for a smooth experience. It’s also wise to consider providers that maintain strong environmental policies and communicate weight limits or restrictions clearly. Making informed decisions ensures renovation waste is managed safely, efficiently, and within budget.

5 Ways to Make a Statement Without Speaking a Word

0

Jewelry is so much more than decoration. It’s a language. Whether loud or quiet, bold or minimal, the pieces we choose reflect who we are, what we value, and how we feel without ever having to say a single word. In a world driven by visuals, our accessories often say more than introductions ever could.


  1. The Language of Jewelry: What Your Accessories Say About You

Since ancient times, jewelry has conveyed deeper themes of identity and meaning. Across cultures, it has marked status, celebrated life milestones, and displayed faith. Today, what you wear close to your body still carries subtle messages about your personality, lifestyle, and mood. Are you refined or rebellious? Sentimental or expressive? Jewelry speaks volumes.

  1. Statement Pieces That Speak Volumes

Some pieces don’t just accessorize an outfit but end up defining it. Oversized earrings, architectural cuffs, or a daring necklace can all transform your look and attitude. These items are more than fashion; they’re declarations of confidence and creativity. If you want to turn heads or show off a fearless streak, let your jewelry lead the way.

  1. Minimalism with Meaning: The Subtle Art of Understated Pieces

Statement-making doesn’t always require scale or sparkle. A single gold band, a thin chain, or dainty studs can signal refinement and intentionality. These quiet choices speak to self-assurance and style that doesn’t need to shout. Understated jewelry is often the most personal, revealing layers of character with every small detail.

  1. Sentimental Jewelry: Wearing Your Story

Not all jewelry is about aesthetics. Some pieces carry your history. A locket with a loved one’s photo, a charm engraved with coordinates, or a ring passed down through generations all become part of your story. These items express love, loss, heritage, and identity, reminding you—and others—of where you come from and who you hold close.

  1. Rings that Represent: From Power to Partnership

Rings carry layered meanings. A stacked band might symbolize independence. A bold cocktail ring can reflect power and self-celebration. While engagement rings are traditionally tied to proposals and romance, modern choices like halo engagement rings go beyond convention—they’re a bold statement of personality. The halo design’s brilliance and symmetry express a love of elegance and individuality, making it a powerful piece of wearable art that speaks volumes about the wearer’s sense of self, whether worn for commitment or simply as a personal favorite.

Final Thoughts

What you choose to wear on your body doesn’t have to be random. It can hold just as much meaning as any other item of clothing. Great jewelry lets you show emotion, carry memories, and highlight identity. In a quick glance, it can reveal your personal story, style, and spirit. You don’t need to say a word because your exquisite pieces will say it all for you.

Tonight’s Rare Lunar Standstill Will Create A Once-In-A-Generation Strawberry Moon Over Charlotte

0

Charlotte skywatchers will have a rare opportunity to witness a once-in-a-generation lunar event tonight.



This year’s Strawberry Moon will officially be the lowest full moon in nearly two decades, due to a phenomenon called a major lunar standstill. This event, which occurs once every 18.6 years, causes the moon to rise and set at extreme positions along the horizon. As a result, the moon will appear unusually low in the night sky across the Northern Hemisphere.

The moon will rise around 8:30 p.m. EST and reach its peak brightness at 3:44 a.m. on June 11, according to EarthSky.org.

The name “Strawberry Moon” comes from northeastern Native American tribes who marked this full moon with the ripening of June-bearing strawberries. Some tribes also call it the Berries Ripen Moon, signifying the seasonal bloom of flowers and fruit.

Another full moon this low in the sky is not expected until 2043, making tonight’s event a unique visual occurrence.

Teen Airlifted Out of NC Woods After Nearly Fatal Timber Rattlesnake Bite

0

A teenager was rescued from deep inside the woods of Avery County after being bitten by a rattlesnake. The incident prompted a multi-agency response, including the North Carolina Helo-Aquatic Rescue Team (NCHART) and Charlotte Fire Department technicians.

A National Guard Black Hawk helicopter assisted in the operation, airlifting the teen from a rocky creekside in the mountainous terrain. Once safely evacuated, the teenager was transported to a hospital for treatment.

North Carolina Emergency Management shared the details on Facebook, where Zain Shah identified himself as the bite victim.

Timber rattlesnakes are native to the region and often inhabit forested mountain areas.

According to NC PARC, timber rattlers are large, venomous snakes known for their chevron patterns and black tails. While generally reclusive ambush predators, they pose serious risks when encountered. Their population remains stable in the mountains and Coastal Plain but has declined in the Piedmont due to habitat loss.

This NC City Was Just Ranked The Deadliest In America For Rush Hour Drivers

0

rush hourNew data from the National Highway Traffic Safety Administration (NHTSA) has just revealed which major cities are the most deadly during rush hour, with drivers in Winston Salem, North Carolina deemed the least safe.

The crashes that occurred during the hours of 7am to 9am and 5pm to 7pm in major cities in the US were calculated as a percentage of the total crashes to identify the locations with the deadliest rush hours.

According to the data, traveling on the roads in these busy times poses the most risk for residents in Winston Salem.

Throughout the five years analyzed, 36 out of 118 fatal crashes occurred during peak rush hour times, equating to 30.51%. This was found to be 29% higher than the U.S. national average of 22.77%.

Phoenix, Arizona with emphasis on Scottsdale is the second worst city for lethal collisions during rush hours, with 32 deadly crashes occurring during peak hours out of a total of 107. This equals 29.91%, which is 27% above the US average.

The third is Kansas City, Kansas, with 30 out of 101 fatal crashes happening during rush hours, which is the equivalent of 29.7% – 26% higher than the national average.

The 10 U.S cities with the most dangerous rush hours

Rank

City

Number of fatal crashes occurring during rush hours (2018 – 2022)

Total number of fatal vehicle crashes (2018 – 2022)

Percentage of fatal crashes that occurred during rush hours (2018 – 2022)

1.

Winston Salem, NC

36

118

30.51%

2.

Phoenix (Scottsdale), AZ

32

107

29.91%

3.

Kansas City, KS

30

101

29.70%

4.

Mobile, AL

42

143

29.37%

5.

Las Vegas, NV

59

202

29.21%

6.

Tucson, AZ

152

521

29.17%

7.

Fayetteville, NC

30

105

28.57%

8.

Norfolk, VA

32

113

28.32%

9.

Shreveport, LA

39

139

28.06%

10.

Fort Wayne, IN

31

111

27.93%

Pusoy Dos: The Rising Star of Filipino Card Games in the Digital Age

0

In the ever-evolving landscape of online gaming, traditional Filipino card games are experiencing a renaissance, with Pusoy Dos emerging as a frontrunner alongside the popular Tongits. GameZone, a leading digital platform under DigiPlus, has been instrumental in bringing these beloved pastimes into the digital realm, offering players a chance to enjoy their favorite games in a modern, accessible format.

The Allure of Pusoy Dos

Pusoy Dos card game, with its simple yet engaging rules, has captured the hearts of Filipino gamers and beyond. This card game, which blends elements of poker and Pusoy, offers a unique gaming experience that is both familiar and exciting. Its straightforward gameplay makes it easy for newcomers to pick up, while its strategic depth keeps seasoned players coming back for more.

GameZone’s initiative to promote how to play Pusoy Dos online and other traditional Filipino card games online is more than just a business move; it’s a cultural preservation effort. By digitalizing these games, GameZone is ensuring that younger generations have access to and can appreciate these important aspects of Filipino culture.

The Player vs. Player Revolution

One of the most significant advancements in the online Pusoy Dos pattern experience is the introduction of Player vs. Player (PVP) mode on GameZone. This feature has transformed the game from a solitary pastime into a dynamic, social experience. Unlike playing against AI, which can become predictable, PVP mode offers a constantly changing challenge as players face off against real opponents with unique strategies and playing styles.

The unpredictability of human opponents adds an extra layer of excitement to each game. Players must constantly adapt their strategies, read their opponents, and make split-second decisions. This level of engagement is not only more thrilling but also more intellectually stimulating than playing against computer-generated opponents.

Moreover, the PVP mode has turned Pusoy Dos rules into a social platform. Players can challenge friends, meet new rivals, and become part of a larger gaming community. This social aspect adds depth to the gaming experience, creating opportunities for friendly competition, shared experiences, and even new friendships based on a common interest in Filipino card games.

The social dimension of PVP mode also serves as a virtual gathering place for Pusoy Dos strategy enthusiasts. It allows for the exchange of strategies, the evolution of meta-game tactics, and the preservation and spread of these traditional games in a modern, digital format. This not only keeps the games alive but also introduces them to new generations of players who might not have encountered them in their traditional physical form.

Rewarding Players: GameZone’s Promotional Strategy

Understanding that player engagement goes beyond just offering great games, GameZone casino has implemented a comprehensive system of promotions and incentives. These offerings are designed to enhance the player experience and provide additional value to users of the platform.

One of the key features of GameZone’s promotional strategy is the rebate system. This allows players to recoup a portion of their losses, effectively reducing the risk associated with playing and encouraging continued engagement. For new users, welcome bonuses serve as an attractive incentive, providing extra credits or special perks to kickstart their GameZone online experience.

The platform also offers game-specific promotions, adding an extra layer of excitement to individual titles. These might include special events, bonus rounds, or increased payouts for certain games, keeping the gameplay fresh and rewarding for regular players.

Perhaps the most thrilling aspect of GameZone’s promotional strategy is the organization of both online and offline tournaments. These events create a competitive atmosphere where players can test their skills against others, vying for substantial prize pools. The inclusion of offline tournaments also bridges the gap between digital and physical play, fostering a sense of community among players.

These varied promotions serve a dual purpose. Firstly, they provide players with additional opportunities to win prizes beyond their regular game winnings, increasing the overall value proposition of the platform. Secondly, they act as a powerful retention tool, encouraging players to return regularly to take advantage of new offers and events.

The Importance of PAGCOR Recognition

In the world of online gaming, trust and security are paramount. This is where PAGCOR (Philippine Amusement and Gaming Corporation) plays a crucial role. As a government-owned entity responsible for regulating the gaming industry in the Philippines, PAGCOR ensures that all gaming operations adhere to legal and ethical standards.

GameZone’s status as a PAGCOR-licensed platform is a significant endorsement of its commitment to maintaining high standards of integrity and fairness. This licensing arrangement serves multiple purposes. Firstly, it legitimizes GameZone’s operations, providing a seal of approval from the country’s official gaming regulator. Secondly, it assures users of a secure and regulated gaming environment that fully complies with national standards and regulations.

Moreover, GameZone’s PAGCOR license underscores its dedication to responsible gaming practices. This commitment not only fosters trust among its user base but also solidifies GameZone’s position as a reputable and reliable player in the Philippine online gaming industry. By aligning itself with PAGCOR’s stringent requirements, GameZone sets a positive example for other operators in the sector and contributes to the overall integrity of the online gaming landscape in the Philippines.

Promoting Responsible Gaming

GameZone takes its commitment to responsible gaming a step further with its innovative approach of appointing responsible gaming ambassadors. These ambassadors, chosen from finalists of the previous year’s Tongits Champions Cup, serve as role models for the gaming community. As accomplished players themselves, they demonstrate how to enjoy online gaming while maintaining a balanced and responsible approach.

This strategy effectively reinforces responsible gaming practices among users, highlighting GameZone’s commitment to player well-being. By integrating responsible gaming advocacy into community-building efforts, the platform sets a positive example for the industry at large. This proactive approach not only enhances GameZone’s reputation but also contributes to creating a safer and more sustainable gaming environment, potentially influencing industry standards and practices.

Conclusion

The rise of Pusoy Dos in the digital gaming space, particularly on platforms like GameZone, represents a fascinating blend of tradition and innovation. By bringing this beloved Filipino card game online and enhancing it with features like PVP mode, GameZone is not just preserving cultural heritage but also evolving it for a new generation of players.

The platform’s commitment to player engagement, evidenced by its robust promotional strategies and tournaments, ensures that the Pusoy Dos community remains active and growing. Meanwhile, its adherence to PAGCOR regulations and focus on responsible gaming practices demonstrate a commendable commitment to ethical operations.