
 The majority of Forex traders don’t have any trading experience. Not knowing any strategies to use and being new to the digital market can be pretty confusing. Bollinger Bands is the solution to that problem because it offers various insights into the digital market’s volatility and value.
Things to Know About Bollinger Bands
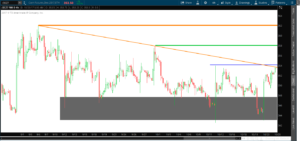
The most common tool that traders use as an indicator is called Bollinger Bands. John Bollinger developed it in the 1980s. The tool also allows traders to assess the durability of investment in a relatively short period. The Bollinger Bands are composed of three “bands,” which are:
- Middle Band – the average standard or mean of the trend.
- Upper Band – pair of standard deviations over the middle band.
- Lower band – pair of standard deviations underneath the middle band.
Band expansion happens if the volatility significantly increases, and once the price decreases in volatility, it will contract. The method used in Bollinger Bands is:
- Upper Bollinger Band = Moving Average (Standard Deviation) + Number of Standard Deviations x (Standard Deviation)
- Lower Bollinger Band = Moving Average (Standard Deviation) – Number of Standard Deviations x (Standard Deviation)
Various Approaches to Use in Trading
Since people in the digital market widely utilize Bollinger Bands, formulating approaches through it is essential. There are multiple ways to refine Bollinger Bands’ strategy to use for automation. Programming by adding a couple of complex rules is allowed, and you can add details such as using “stops” when you buy or adjust a few parameters.
Digital market trading can be difficult for active short-term investors because they can’t predict the market trend. However, Bollinger Bands are created to help these short-term traders decide when to make their moves. In connection to this, tools for trading can also be helpful to use in the broad market.
Oversold and Overbought Assets
The strategy is the most usual action that traders use to identify the market condition. Once the asset went underneath the lower band, it indicates a price fall, and a bounce may happen. However, if the value crashes beyond the upper band, it shows that overbought in the market occurred, and the trader should pull back.
The Bollinger Bands practices mean reversion as the main concept. The concept assumes that if the price deviates to a great extent from the standard or the middle band, it will roll back to its mean price after some time.
Multiple Bands for Digital Market
Bollinger Bands are helpful indicators for diagnosing trends because it measures deviation. Every tradesperson can generate a couple of sets of Bollinger bands. The parameter in the first is arranged to use one standard deviation, while the other will use the common pair of standard deviations. A framework like this can be helpful to traders who want to look at prices from a bigger perspective.
Trend indicators, such as Bollinger Bands, can adjust dynamically to the expanding and contracting price as volatility goes higher or lower. In connection to this, the bands can narrow or widen together with the price action naturally and create an accurate trend indicator.
Trend and Fade Traders
Once you already know the process of how to use Bollinger Bands properly, it’s now time to understand that this tool can be used by trend traders and fade traders. Trend traders are the ones who seek to accomplish momentum, while fade traders are the ones who want to profit from trend reversals. The Bollinger Bands are indicators, and using tools like this is a great way to help the traders.
Squeeze Strategy
Strategies are needed when trading, and another approach that you can make with Bollinger Bands is called squeezing. The squeeze strategy happens only if the price has been moving actively and moving in a tight compression sideways. Strategies like squeezing can be a challenge for new traders, considering it doesn’t always occur, and you have to wait for it.
The process of squeezing can be identified visually due to the upper and lower band closeness to each other, and it indicates a decrease in the volatility of the asset. After the squeeze, a more significant move of price in any direction happens, mainly on high volume. The volume expansion indicates that various traders use their money to vote on continuing the price move in the breakout direction.
Conclusion
Bollinger Bands can be used in multiple ways, such as trade signals of overbought and oversold, multiple bands, and volatility contractions. The tool can be used anytime in trading to indicate the entry and exit points of trades. However, if you use the bands on their own it can be risky because it only focuses on the price and volatility of trades and ignores many other relevant pieces of information.
Trading tools like Bollinger Bands are simple, useful, and extremely popular among trading professionals and newbie traders around the world.
