
 Yesterday we saw the biggest voter turnout for a midterm election in North Carolina’s history amidst a growing political divide both locally and nationally.
This year’s elections held many key races, including 13 seats in the US House, 6 new amendments to our state constitution, 1 state supreme court seat, 50 state senate seats, and 120 state house seats.
With most of the votes now tallied, Democrats are seeing some marginal gains, winning 1 more Supreme Court seat, and breaking the Republicans’ 3-5ths “supermajority” power (which has allowed them to veto Democrat Governor Roy Cooper’s policies) in both the NC House and NC Senate.
Here are the complete results from North Carolina’s 2018 Midterm Elections;
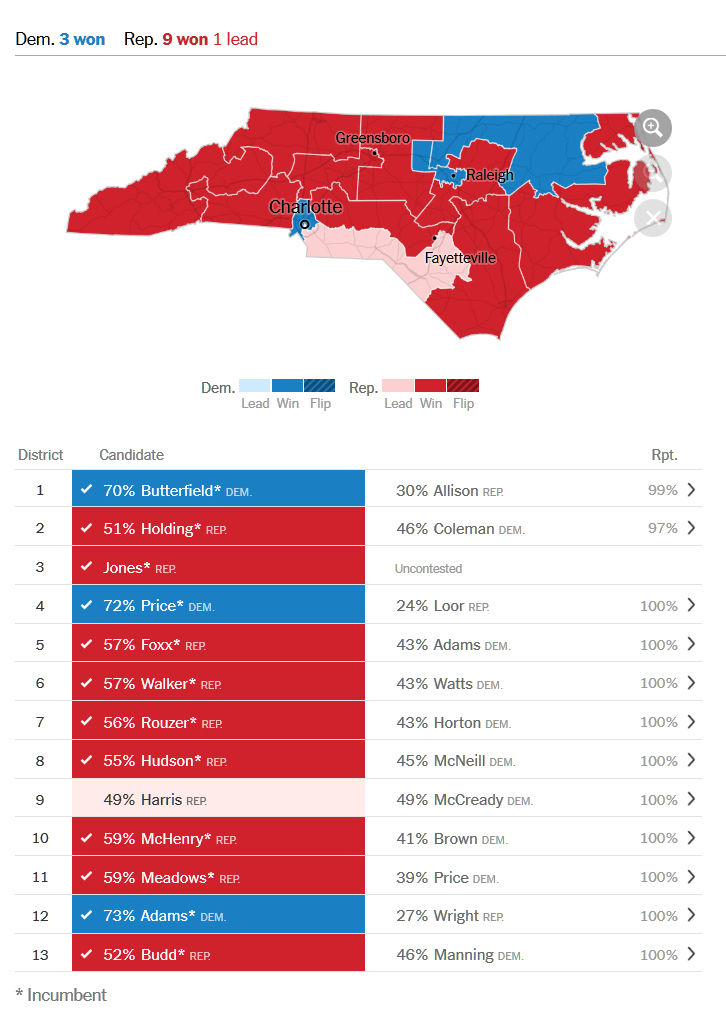
North Carolina’s US House Results
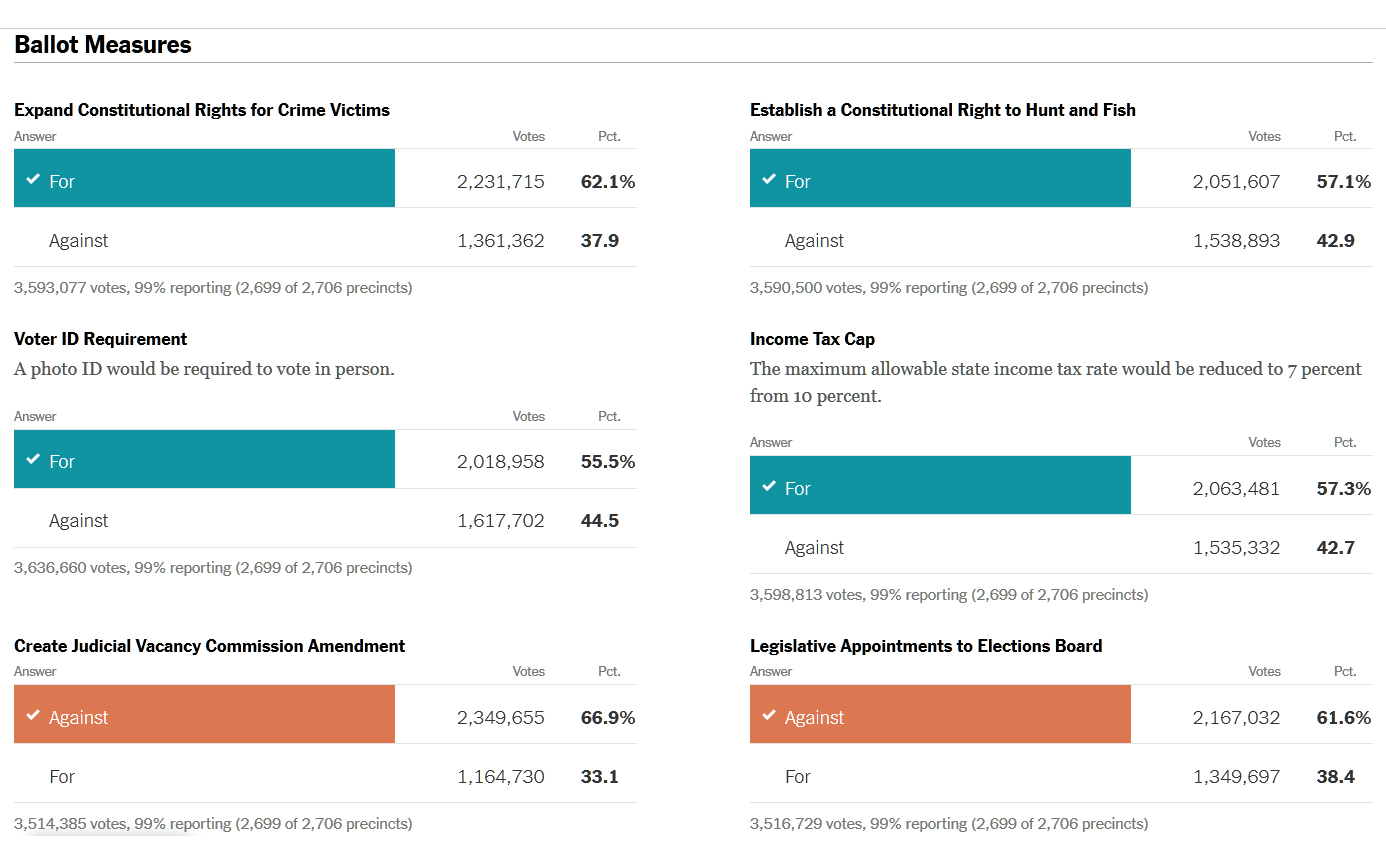
North Carolina Constitutional Amendment Results
North Carolina Supreme Court Results
Democrat Anita Earls won against Associate Justice Barbara Jackson and Raleigh lawyer Chris Anglin, giving Democrats 5 out of the 7 seats on the state’s highest court.
North Carolina State Senate Results
| District | Winning Candidate | Defeated Candidate | Rpt. |
|---|---|---|---|
| 1 | 53%Steinburg Rep. | 47%Phelps Dem. | 100% |
| 2 | 62%Sanderson* Rep. | 35%Garner Dem. | 97% |
| 3 | 54%Smith* Dem. | 46%Earley Rep. | 100% |
| 4 | 58%Fitch* Dem. | 40%Scott Rep. | 100% |
| 5 | 55%Davis* Dem. | 45%Robb Rep. | 100% |
| 6 | 65%Brown* Rep. | 35%Webb Dem. | 100% |
| 7 | 54%Pate* Rep. | 46%Brantley Dem. | 92% |
| 8 | 59%Rabon* Rep. | 39%Sink Dem. | 100% |
| 9 | 49%Peterson Dem. | 48%Lee* Rep. | 100% |
| 10 | 63%Jackson* Rep. | 38%Moore Dem. | 100% |
| 11 | 57%Horner* Rep. | 43%Pacer Dem. | 100% |
| 12 | 60%Burgin Rep. | 41%Sivoli Dem. | 96% |
| 13 | 63%Britt* Rep. | 37%Campbell Dem. | 100% |
| 14 | 71%Blue* Dem. | 26%Andrews Rep. | 100% |
| 15 | 73%Chaudhuri* Dem. | 23%Michael Rep. | 100% |
| 16 | 65%Nickel Dem. | 31%Smith Rep. | 100% |
| 17 | 50%Searcy Dem. | 47%Barringer* Rep. | 100% |
| 18 | 50%Alexander* Rep. | 47%Paul Dem. | 100% |
| 19 | 50%DeViere Dem. | 50%Meredith* Rep. | 100% |
| 20 | 84%McKissick* Dem. | 14%Stark Rep. | 100% |
| 21 | 71%Clark* Dem. | 29%Leever Rep. | 100% |
| 22 | 62%Woodard* Dem. | 36%Padgett Rep. | 100% |
| 23 | 71%Foushee* Dem. | 29%Glendinning Rep. | 100% |
| 24 | 54%Gunn* Rep. | 46%Wooten Dem. | 100% |
| 25 | 57%McInnis* Rep. | 43%Probst Mills Dem. | 100% |
| 26 | 65%Tillman* Rep. | 35%McCaskill Dem. | 100% |
| 27 | 50%Garrett Dem. | 50%Wade* Rep. | 100% |
| 28 | 75%Robinson* Dem. | 25%Porter Rep. | 100% |
| 29 | 72%Gallimore Rep. | 28%Love Dem. | 100% |
| 30 | 63%Berger* Rep. | 34%Mangrum Dem. | 100% |
| 31 | 61%Krawiec* Rep. | 39%Motsinger Dem. | 100% |
| 32 | 73%Lowe* Dem. | 27%Henderson Rep. | 100% |
| 33 | 68%Ford Rep. | 32%Wilhelm Dem. | 100% |
| 34 | 70%Sawyer Rep. | 30%McMiller Dem. | 100% |
| 35 | 62%Johnson Rep. | 38%Walker Dem. | 100% |
| 36 | 57%Newton* Rep. | 43%Shelley Dem. | 100% |
| 37 | 78%Jackson* Dem. | 20%Trotman Rep. | 100% |
| 38 | 82%Mohammed Dem. | 18%Rivette Rep. | 100% |
| 39 | 53%Bishop* Rep. | 47%Stachowicz Dem. | 100% |
| 40 | 76%Waddell* Dem. | 24%Shields Rep. | 100% |
| 41 | 57%Marcus Dem. | 43%Tarte* Rep. | 97% |
| 42 | 66%Wells* Rep. | 34%Vandett Dem. | 100% |
| 43 | 64%Harrington* Rep. | 34%Price Dem. | 100% |
| 44 | 69%Alexander Rep. | 31%Lattimore Dem. | 100% |
| 45 | 65%Ballard* Rep. | 35%Luther Dem. | 100% |
| 46 | 70%Daniel* Rep. | 30%Sherwood Dem. | 100% |
| 47 | 62%Hise* Rep. | 38%Wheeler Dem. | 100% |
| 48 | 56%Edwards* Rep. | 44%Bossert Dem. | 100% |
| 49 | 64%Van Duyn* Dem. | 34%Crawford Rep. | 100% |
| 50 | 60%Davis* Rep. | 40%Kuppers Dem. | 100% |
| – Show fewer races | |||
North Carolina State House Results
| District | Winning Candidate | Defeated Candidate | Rpt. |
|---|---|---|---|
| 1 | 53%Goodwin Rep. | 47%Wesson Dem. | 100% |
| 2 | 55%Yarborough* Rep. | 45%Moss Dem. | 95% |
| 3 | 55%Speciale* Rep. | 42%Lee Dem. | 100% |
| 4 | 63%Dixon* Rep. | 35%Love Dem. | 100% |
| 5 | 60%Hunter* Dem. | 40%Smith Rep. | 100% |
| 6 | 55%Hanig Rep. | 45%Judge Dem. | 95% |
| 7 | 58%Barnes Rep. | 42%Richardson* Dem. | 100% |
| 8 | 64%Smith Dem. | 36%Smith Rep. | 91% |
| 9 | 60%Murphy* Rep. | 40%Rixon Dem. | 100% |
| 10 | 69%Bell* Rep. | 31%Blackmon Dem. | 100% |
| 11 | 69%Dahle Dem. | 27%Brooks Rep. | 100% |
| 12 | 56%Humphrey Rep. | 44%Graham* Dem. | 85% |
| 13 | 73%McElraft* Rep. | 27%diMaio Ind. | 100% |
| 14 | 59%Cleveland* Rep. | 41%Johnson Dem. | 100% |
| 15 | 67%Shepard* Rep. | 33%Whitten Dem. | 100% |
| 16 | 59%Smith Rep. | 41%Johnson Dem. | 100% |
| 17 | 64%Iler* Rep. | 37%Simmons Dem. | 100% |
| 18 | 62%Butler* Dem. | 35%Harmati Rep. | 100% |
| 19 | 49%Davis* Rep. | 47%Morgan Dem. | 100% |
| 20 | 53%Grange* Rep. | 47%Cohen Dem. | 100% |
| 21 | 53%Smith Dem. | 47%Freeman Rep. | 100% |
| 22 | 57%Brisson* Rep. | 43%Denning Dem. | 100% |
| 23 | 61%Willingham* Dem. | 39%Holtzman Rep. | 100% |
| 24 | 51%Farmer-Butterfield* Dem. | 49%Fontenot Ind. | 100% |
| 25 | 51%Gailliard Dem. | 45%Check Rep. | 100% |
| 26 | 60%White* Rep. | 40%Bennett Dem. | 100% |
| 27 | 69%Wray* Dem. | 31%Dyer Rep. | 100% |
| 28 | 63%Strickland* Rep. | 34%Massengill Dem. | 95% |
| 29 | 88%Black* Dem. | 12%Becker Rep. | 100% |
| 30 | 74%Morey* Dem. | 24%Burch Rep. | 100% |
| 31 | 81%Forde-Hawkins Dem. | 16%Webson Rep. | 100% |
| 32 | 64%Garrison* Dem. | 36%Shingler Rep. | 100% |
| 33 | 79%Gill* Dem. | 21%Murtha Rep. | 100% |
| 34 | 66%Martin* Dem. | 32%Whiteford Rep. | 100% |
| 35 | 51%Everitt Dem. | 46%Malone* Rep. | 100% |
| 36 | 49%von Haefen Dem. | 48%Dollar* Rep. | 100% |
| 37 | 50%Batch Dem. | 48%Adcock Rep. | 100% |
| 38 | 82%Holley* Dem. | 16%Bagnal Rep. | 100% |
| 39 | 66%Jackson* Dem. | 32%Allen Rep. | 100% |
| 40 | 52%John* Dem. | 45%Avila Rep. | 100% |
| 41 | 67%Adcock* Dem. | 33%Wilder Rep. | 100% |
| 42 | 76%Lucas* Dem. | 21%Williams Rep. | 100% |
| 43 | 74%Floyd* Dem. | 26%Czajkowski Rep. | 100% |
| 44 | 57%Richardson* Dem. | 44%Devore Rep. | 100% |
| 45 | 59%Szoka* Rep. | 42%Florez Dem. | 100% |
| 46 | 64%Jones* Rep. | 37%Yates-Lockamy Dem. | 94% |
| 47 | 59%Graham* Dem. | 41%Lowery Rep. | 100% |
| 48 | 63%Pierce* Dem. | 37%Walker Rep. | 100% |
| 49 | 66%Ball* Dem. | 31%Robertson Rep. | 100% |
| 50 | 62%Meyer* Dem. | 38%Rothrock Rep. | 100% |
| 51 | 53%Sauls* Rep. | 47%Mathis Dem. | 100% |
| 52 | 63%Boles* Rep. | 37%Simon Dem. | 100% |
| 53 | 62%Lewis* Rep. | 38%Chapman Dem. | 92% |
| 54 | 63%Reives* Dem. | 37%Stobbs Rep. | 100% |
| 55 | 65%Brody* Rep. | 35%Deese Dem. | 100% |
| 56 | 86%Insko* Dem. | 11%Cooke Rep. | 100% |
| 57 | 68%Clemmons Dem. | 33%Lawson Rep. | 100% |
| 58 | 77%Quick* Dem. | 23%Boykin Rep. | 100% |
| 59 | 57%Hardister* Rep. | 43%Buccini Dem. | 100% |
| 60 | 69%Brockman* Dem. | 31%Collins Rep. | 100% |
| 61 | 73%Harrison* Dem. | 27%Batts Rep. | 100% |
| 62 | 57%Faircloth* Rep. | 43%Shafer Dem. | 100% |
| 63 | 51%Ross* Rep. | 50%McAdoo Dem. | 100% |
| 64 | 58%Riddell* Rep. | 42%Lynch Dem. | 100% |
| 65 | 57%Carter Rep. | 35%Lee Dem. | 100% |
| 66 | 51%Goodman* Dem. | 47%Davis Rep. | 100% |
| 67 | 73%Sasser Rep. | 24%Webster Dem. | 100% |
| 68 | 59%Horn* Rep. | 41%Foulke Dem. | 100% |
| 69 | 60%Arp* Rep. | 40%Benson Dem. | 100% |
| 70 | 77%Hurley* Rep. | 23%Rulli Dem. | 100% |
| 71 | 73%Terry* Dem. | 27%Arnold Rep. | 100% |
| 72 | 79%Montgomery Dem. | 21%Reid Rep. | 100% |
| 73 | 64%Zachary* Rep. | 36%Stinson Dem. | 100% |
| 74 | 55%Conrad* Rep. | 45%LeGrand Dem. | 100% |
| 75 | 53%Lambeth* Rep. | 47%Besse Dem. | 100% |
| 76 | 61%Warren* Rep. | 39%Fowler Dem. | 100% |
| 77 | 74%Howard* Rep. | 26%Clark Dem. | 97% |
| 78 | 79%McNeill* Rep. | 21%Meredith Dem. | 100% |
| 79 | 61%Kidwell Rep. | 39%Langley Dem. | 100% |
| 80 | 75%Jarvis Rep. | 25%Sellars Dem. | 100% |
| 81 | 72%Potts* Rep. | 28%Phillips Dem. | 100% |
| 82 | 53%Johnson* Rep. | 47%Steele Dem. | 100% |
| 83 | 53%Pittman* Rep. | 47%Young Dem. | 100% |
| 84 | 69%Turner* Rep. | 31%Edwards Dem. | 100% |
| 85 | 75%Dobson* Rep. | 25%Larsen Dem. | 100% |
| 86 | 65%Blackwell* Rep. | 36%Barnsback Dem. | 100% |
| 87 | 73%Hall* Rep. | 27%Bregel Dem. | 100% |
| 88 | 76%Belk* Dem. | 24%Turner Rep. | 100% |
| 89 | 72%Setzer* Rep. | 28%Cranford Dem. | 100% |
| 90 | 68%Stevens* Rep. | 27%Wiles Dem. | 100% |
| 91 | 73%Hall* Rep. | 25%Booth Dem. | 100% |
| 92 | 70%Beasley* Dem. | 30%Ware Rep. | 100% |
| 93 | 52%Russell Dem. | 48%Jordan* Rep. | 100% |
| 94 | 73%Elmore* Rep. | 27%Little Dem. | 100% |
| 95 | 64%Fraley* Rep. | 36%Fassbender Dem. | 100% |
| 96 | 61%Adams* Rep. | 39%Bost Dem. | 100% |
| 97 | 71%Saine* Rep. | 30%Robertson Dem. | 100% |
| 98 | 50%Clark Dem. | 50%Bradford* Rep. | 100% |
| 99 | 82%Majeed Dem. | 18%Niday Rep. | 100% |
| 100 | 71%Autry* Dem. | 29%Campbell Rep. | 100% |
| 101 | 79%Logan Dem. | 21%Mauney Rep. | 100% |
| 102 | 83%Carney* Dem. | 17%Norris Rep. | 100% |
| 103 | 50%Brawley* Rep. | 50%Hunt Dem. | 100% |
| 104 | 52%Lofton Dem. | 48%Dulin* Rep. | 100% |
| 105 | 52%Harris Dem. | 48%Stone* Rep. | 100% |
| 106 | 81%Cunningham* Dem. | 20%Sherow Rep. | 100% |
| 107 | Alexander* Dem. | Uncontested | |
| 108 | 60%Torbett* Rep. | 40%Kellogg Dem. | 95% |
| 109 | 59%Bumgardner* Rep. | 41%Maxon Dem. | 100% |
| 110 | 68%Hastings* Rep. | 32%McCleary Dem. | 100% |
| 111 | 65%Moore* Rep. | 35%Brinkley Dem. | 100% |
| 112 | 71%Rogers* Rep. | 29%Gallagher Dem. | 100% |
| 113 | 58%Henson* Rep. | 42%Edney Dem. | 100% |
| 114 | 82%Fisher* Dem. | 18%Lindstam Rep. | 98% |
| 115 | 58%Ager* Dem. | 42%Evans Rep. | 100% |
| 116 | 55%Turner* Dem. | 45%Brown Rep. | 100% |
| 117 | 60%McGrady* Rep. | 40%Kemp Dem. | 100% |
| 118 | 57%Presnell* Rep. | 43%Schandevel Dem. | 100% |
| 119 | 52%Queen Dem. | 48%Clampitt* Rep. | 100% |
| 120 | 73%Corbin* Rep. | 27%Martin Dem. | 100% |
| – Show fewer races | |||
What are your thoughts on the election results?
