
 With Tax Day drawing near, the coronavirus wreaking havoc on the economy, and tax relief being considered in response, the personal-finance website WalletHub today released an in-depth analysis of 2020’s Most & Least Federally Dependent States.
This report illustrates the extent to which states are independent economically. However, the oxymoron in this situation is that states with a higher level of federal dependence are likely better positioned to handle the coronavirus pandemic, given that most relief will come from the federal government. In order to identify which states most and least depend on federal support, WalletHub compared the 50 states across three key metrics: return on taxes paid to the federal government; federal funding as a share of state revenue; and share of federal jobs.
Most Federally Dependent States
| Rank (1 = Most Dependent) |
State | Total Score | ‘State Residents’ Dependency’ Rank | ‘State Government’s Dependency’ Rank |
|---|---|---|---|---|
| 1 | New Mexico | 82.21 | 1 | 6 |
| 2 | Mississippi | 79.41 | 5 | 4 |
| 3 | West Virginia | 70.70 | 4 | 9 |
| 4 | Montana | 70.70 | 14 | 1 |
| 5 | Kentucky | 69.78 | 6 | 8 |
| 6 | Alaska | 67.92 | 7 | 7 |
| 7 | Arizona | 65.61 | 12 | 5 |
| 8 | Indiana | 62.77 | 9 | 10 |
| 9 | Alabama | 61.56 | 8 | 14 |
| 10 | South Carolina | 61.31 | 3 | 30 |
| 11 | Wyoming | 58.92 | 23 | 2 |
| 12 | Louisiana | 54.20 | 30 | 3 |
| 13 | North Dakota | 53.11 | 2 | 44 |
| 14 | Maine | 47.40 | 15 | 19 |
| 15 | Tennessee | 46.90 | 21 | 11 |
| 16 | Pennsylvania | 46.43 | 17 | 16 |
| 17 | Missouri | 44.47 | 24 | 12 |
| 18 | Maryland | 41.82 | 13 | 31 |
| 19 | Oklahoma | 41.42 | 19 | 21 |
| 20 | Vermont | 40.45 | 18 | 24 |
| 21 | Arkansas | 39.26 | 40 | 13 |
| 22 | South Dakota | 38.59 | 25 | 17 |
| 23 | Georgia | 35.21 | 32 | 18 |
| 24 | Oregon | 34.45 | 26 | 26 |
| 25 | New York | 33.89 | 46 | 15 |
| 26 | Michigan | 33.52 | 29 | 23 |
| 27 | Idaho | 33.39 | 20 | 33 |
| 28 | Florida | 33.26 | 27 | 27 |
| 29 | New Hampshire | 32.67 | 35 | 22 |
| 30 | Rhode Island | 31.49 | 37 | 25 |
| 31 | Nevada | 31.37 | 36 | 29 |
| 32 | Ohio | 30.38 | 45 | 20 |
| 33 | Wisconsin | 30.22 | 16 | 45 |
| 34 | Texas | 30.15 | 42 | 28 |
| 35 | North Carolina | 27.95 | 31 | 35 |
| 36 | Colorado | 25.66 | 39 | 36 |
| 37 | Connecticut | 25.31 | 22 | 43 |
| 38 | Iowa | 25.30 | 34 | 37 |
| 39 | California | 24.97 | 43 | 34 |
| 40 | Nebraska | 24.78 | 44 | 32 |
| 41 | Hawaii | 24.65 | 10 | 50 |
| 42 | Washington | 24.18 | 38 | 38 |
| 43 | Virginia | 23.73 | 11 | 49 |
| 44 | Minnesota | 19.75 | 28 | 46 |
| 45 | Massachusetts | 19.16 | 47 | 39 |
| 46 | Illinois | 18.40 | 48 | 41 |
| 47 | New Jersey | 17.55 | 49 | 40 |
| 48 | Delaware | 15.42 | 50 | 42 |
| 49 | Utah | 15.23 | 33 | 47 |
| 50 | Kansas | 11.84 | 41 | 48 |
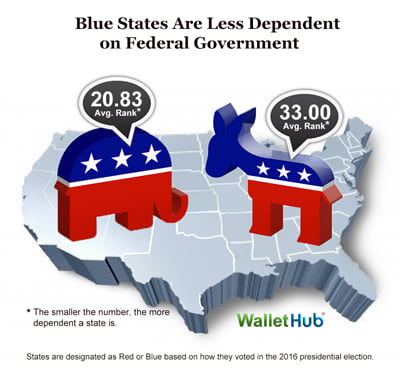
The report also found that Democrat leaning, or ‘blue states’ are less federally dependent than Republican leaning, or ‘red states’;
