
 With multiple companies racing to develop an effective COVID-19 vaccine but 1 in 3 Americans saying they wouldn’t get vaccinated, the personal-finance website WalletHub today released its report on 2020’s States that Vaccinate the Most.
In order to find out which states vaccinate most, the site analyzed the 50 states and the District of Columbia across 18 key metrics, ranging from share of vaccinated children to share of people without health insurance to flu vaccination rate among adults.
South Carolina ranked near the bottom of the report, coming in at #44 in America, and North Carolina ranked among the top half, coming in at #21.
Vaccination Rates by State
| Overall Rank (1 = Most) |
State | Total Score | ‘Children & Teenagers Immunization Rates’ Rank | ‘Adult & Elderly Vaccination Rates’ Rank | ‘Immunization Uptake Disparities & Influencing Factors’ Rank |
|---|---|---|---|---|---|
| 1 | Massachusetts | 79.38 | 1 | 9 | 2 |
| 2 | Vermont | 73.20 | 18 | 1 | 1 |
| 3 | New Hampshire | 69.63 | 7 | 3 | 9 |
| 4 | North Dakota | 69.61 | 2 | 8 | 6 |
| 5 | Rhode Island | 68.34 | 4 | 6 | 8 |
| 6 | Maryland | 65.46 | 9 | 12 | 3 |
| 7 | Washington | 65.09 | 25 | 4 | 4 |
| 8 | Iowa | 64.16 | 21 | 2 | 16 |
| 9 | Nebraska | 61.70 | 11 | 13 | 14 |
| 10 | Oregon | 61.50 | 19 | 7 | 22 |
| 11 | Maine | 60.53 | 13 | 10 | 25 |
| 12 | Pennsylvania | 58.31 | 10 | 20 | 17 |
| 13 | Connecticut | 57.49 | 5 | 29 | 29 |
| 14 | Virginia | 57.43 | 15 | 19 | 12 |
| 15 | Minnesota | 57.24 | 45 | 5 | 5 |
| 16 | Delaware | 57.08 | 3 | 35 | 7 |
| 17 | West Virginia | 56.00 | 12 | 23 | 28 |
| 18 | South Dakota | 55.94 | 23 | 16 | 30 |
| 19 | District of Columbia | 55.74 | 14 | 27 | 18 |
| 20 | Colorado | 55.64 | 27 | 14 | 21 |
| 21 | North Carolina | 52.94 | 28 | 15 | 35 |
| 22 | Wisconsin | 52.67 | 36 | 11 | 32 |
| 23 | Tennessee | 52.30 | 6 | 37 | 19 |
| 24 | Kansas | 51.59 | 26 | 22 | 34 |
| 25 | Illinois | 49.75 | 8 | 43 | 11 |
| 26 | New Mexico | 48.09 | 31 | 26 | 39 |
| 27 | Michigan | 47.89 | 35 | 25 | 33 |
| 28 | Arkansas | 45.61 | 16 | 36 | 46 |
| 29 | Missouri | 45.16 | 41 | 21 | 38 |
| 30 | Kentucky | 45.02 | 29 | 31 | 37 |
| 31 | Montana | 44.87 | 42 | 18 | 47 |
| 32 | Utah | 44.78 | 48 | 24 | 27 |
| 33 | California | 44.68 | 38 | 30 | 20 |
| 34 | Ohio | 43.46 | 40 | 28 | 41 |
| 35 | Idaho | 43.27 | 30 | 38 | 24 |
| 36 | Oklahoma | 41.43 | 50 | 17 | 49 |
| 37 | New York | 41.33 | 33 | 44 | 15 |
| 38 | Indiana | 41.26 | 46 | 32 | 26 |
| 39 | Alabama | 41.04 | 22 | 40 | 50 |
| 40 | Louisiana | 40.53 | 17 | 47 | 48 |
| 41 | Florida | 40.30 | 20 | 49 | 13 |
| 42 | Arizona | 39.86 | 47 | 34 | 31 |
| 43 | Hawaii | 39.78 | 39 | 33 | 43 |
| 44 | South Carolina | 39.48 | 32 | 39 | 45 |
| 45 | Alaska | 39.47 | 37 | 46 | 10 |
| 46 | Nevada | 37.77 | 24 | 50 | 23 |
| 47 | Wyoming | 34.90 | 43 | 42 | 44 |
| 48 | Texas | 34.67 | 49 | 41 | 36 |
| 49 | New Jersey | 33.93 | 34 | 48 | 40 |
| 50 | Georgia | 33.90 | 44 | 45 | 42 |
| 51 | Mississippi | 16.36 | 51 | 51 | 51 |
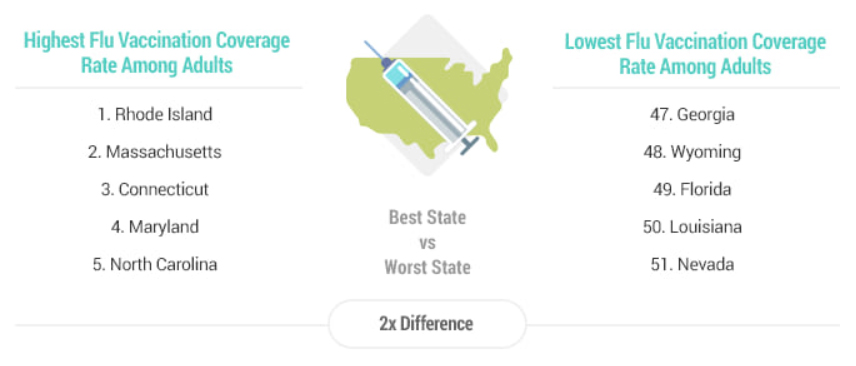
North Carolina was found to have to 5th highest flue vaccination rate among adults in this nation
What do you think about the results?
