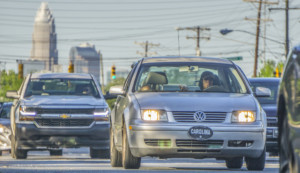
 With U.S. traffic congestion costing U.S. drivers $88 billion in 2019 but driving reduced in 2020 due to the COVID-19 pandemic, the personal-finance website WalletHub today released its report on 2021’s Best & Worst States to Drive in.
To determine the most driver-friendly states in the U.S., the site compared the 50 states across 31 key metrics. The data set ranges from average gas prices to rush-hour traffic congestion to road quality.
According to the report, North Carolina ranks #3 in the nation and South Carolina ranks #31 in the nation.
Best & Worst Driving States
| Overall Rank | State | Total Score | Cost of Ownership & Maintenance | Traffic & Infrastructure | Safety | Access to Vehicles & Maintenance |
|---|---|---|---|---|---|---|
| 1 | Texas | 62.89 | 16 | 33 | 18 | 2 |
| 2 | Indiana | 62.17 | 2 | 22 | 33 | 19 |
| 3 | North Carolina | 61.84 | 3 | 31 | 23 | 9 |
| 4 | Iowa | 61.82 | 17 | 9 | 32 | 22 |
| 5 | Tennessee | 61.63 | 1 | 26 | 41 | 21 |
| 6 | Kentucky | 60.90 | 4 | 24 | 20 | 30 |
| 7 | Maine | 60.60 | 26 | 19 | 5 | 36 |
| 8 | Idaho | 60.59 | 25 | 7 | 15 | 45 |
| 9 | South Dakota | 60.49 | 9 | 2 | 48 | 37 |
| 10 | Ohio | 60.17 | 5 | 32 | 37 | 7 |
| 11 | Wisconsin | 60.11 | 10 | 20 | 40 | 17 |
| 12 | Kansas | 60.03 | 19 | 10 | 31 | 33 |
| 13 | Nebraska | 59.97 | 18 | 8 | 36 | 31 |
| 14 | Illinois | 58.98 | 34 | 37 | 6 | 5 |
| 15 | North Dakota | 58.93 | 24 | 3 | 39 | 46 |
| 16 | Virginia | 58.79 | 7 | 40 | 25 | 13 |
| 17 | Georgia | 58.74 | 12 | 41 | 27 | 8 |
| 18 | Montana | 58.52 | 14 | 1 | 49 | 43 |
| 19 | New York | 58.51 | 40 | 46 | 2 | 4 |
| 20 | Oklahoma | 58.37 | 20 | 15 | 35 | 26 |
| 21 | Utah | 57.86 | 28 | 18 | 12 | 32 |
| 22 | Vermont | 57.70 | 33 | 12 | 10 | 38 |
| 23 | Alabama | 57.69 | 8 | 17 | 44 | 25 |
| 24 | Wyoming | 57.57 | 22 | 4 | 42 | 48 |
| 25 | Arizona | 57.24 | 30 | 21 | 21 | 28 |
| 26 | Arkansas | 57.03 | 23 | 11 | 43 | 34 |
| 27 | Florida | 56.75 | 31 | 37 | 29 | 3 |
| 28 | West Virginia | 56.54 | 13 | 23 | 38 | 42 |
| 29 | Mississippi | 56.38 | 15 | 13 | 46 | 35 |
| 30 | Alaska | 55.74 | 37 | 6 | 17 | 50 |
| 31 | South Carolina | 55.41 | 6 | 27 | 47 | 27 |
| 32 | Minnesota | 55.22 | 27 | 30 | 26 | 18 |
| 33 | Louisiana | 55.05 | 36 | 25 | 9 | 29 |
| 34 | New Mexico | 54.75 | 29 | 5 | 45 | 44 |
| 35 | Connecticut | 54.64 | 43 | 34 | 3 | 24 |
| 36 | Nevada | 54.26 | 39 | 16 | 16 | 41 |
| 37 | Oregon | 54.15 | 45 | 14 | 24 | 23 |
| 38 | Michigan | 53.45 | 41 | 28 | 22 | 11 |
| 39 | Massachusetts | 53.08 | 42 | 50 | 4 | 10 |
| 40 | Missouri | 52.99 | 11 | 29 | 50 | 15 |
| 41 | Colorado | 52.71 | 32 | 39 | 28 | 16 |
| 42 | New Jersey | 51.42 | 44 | 48 | 8 | 12 |
| 43 | New Hampshire | 51.41 | 21 | 45 | 34 | 40 |
| 44 | Pennsylvania | 50.83 | 46 | 44 | 30 | 6 |
| 45 | Rhode Island | 50.13 | 47 | 47 | 1 | 47 |
| 46 | Delaware | 50.01 | 35 | 36 | 11 | 49 |
| 47 | Maryland | 49.91 | 38 | 49 | 14 | 20 |
| 48 | Washington | 49.82 | 48 | 35 | 13 | 14 |
| 49 | California | 49.38 | 49 | 42 | 7 | 1 |
| 50 | Hawaii | 36.42 | 50 | 43 | 19 | 39 |
Driving in North Carolina (1=Best; 25=Avg.):
- 29th – Share of Rush-Hour Traffic Congestion
- 19th – Car Theft Rate
- 9th – Auto-Repair Shops per Capita
- 14th – Avg. Gas Prices
- 5th – Auto-Maintenance Costs
- 16th – Road Quality
- 10th – Car Dealerships per Capita


