
 The pandemic has created major challenges and lifestyle changes for Americans. With more remote work opportunities, people are migrating to cheaper and less crowded cities. To help our readers with that decision, we crunched the numbers to determine what cities they might want to avoid if safety is a primary concern.
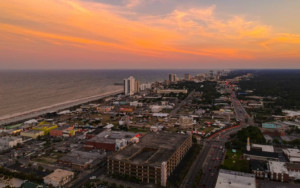
According to the FBI’s latest US Crime Report, Myrtle Beach, SC is now officially the 3rd most dangerous city in the United States. To rank the most dangerous cities, we analyzed the data from cities with a population of 10,000 or more and evaluated the number of reported violent crimes (murder, robbery, aggravated assault, and forcible rape), other personal crimes (simple assault, intimidation, involuntary servitude, kidnapping/abduction), and other property crimes (burglary, arson, motor vehicle theft, and larceny-theft).
According to the FBI’s data, these are the top 5 most dangerous cities for 2021:
- Muskegon Heights, Michigan
- Tukwila, Washington
- Myrtle Beach, South Carolina
- Memphis, Tennessee
- Little Rock, Arkansas.
Myrtle Beach wasn’t the once South Carolina city that earned exceptionally low scores. A total of 8 Palmetto State cities ranked among the bottom 30 in America out of a total of 1,434, including; Myrtle Beach (#3), Cayce (#12), Gaffney (#15), Greenwood (#16), Spartanburg (#17), Florence (#18), and Forest Acres (#26).
| Rank |
State Rank |
City |
State |
Population |
Violent Crimes Per 1,000 |
Other Personal Per 1,000 |
Other Property Per 1,000 |
Score |
|---|---|---|---|---|---|---|---|---|
| 1434 | 135 | Muskegon Heights | MI | 10,717 | 20.9 | 47.21 | 95.92 | 0.07 |
| 1433 | 80 | Tukwila | WA | 20,439 | 7.83 | 21.38 | 212.29 | 0.14 |
| 1432 | 36 | Myrtle Beach | SC | 34,860 | 11.5 | 31.81 | 155.19 | 0.21 |
| 1431 | 54 | Memphis | TN | 650,410 | 19.07 | 39.12 | 87.62 | 0.28 |
| 1430 | 34 | Little Rock | AR | 198,382 | 15.16 | 40.87 | 96.51 | 0.35 |
| 1429 | 136 | Cleveland | OH | 381,829 | 15.23 | 47.86 | 78.76 | 0.42 |
| 1428 | 5 | Monroe | LA | 47,746 | 17.45 | 30.66 | 100.15 | 0.49 |
| 1427 | 134 | Benton Township | MI | 14,372 | 19.13 | 32.49 | 87.04 | 0.56 |
| 1426 | 59 | Henderson | NC | 14,883 | 16.93 | 29.97 | 102.87 | 0.63 |
| 1425 | 33 | Helena-West Helena | AR | 10,187 | 17.57 | 36.42 | 85.8 | 0.7 |
| 1424 | 133 | Detroit | MI | 663,502 | 19.27 | 31.37 | 72.59 | 0.77 |
| 1423 | 35 | Cayce | SC | 14,211 | 9.64 | 42.57 | 91.55 | 0.84 |
| 1422 | 135 | Canton | OH | 70,139 | 13.87 | 40.06 | 75.01 | 0.91 |
| 1421 | 32 | West Memphis | AR | 24,442 | 19.47 | 24.96 | 71.35 | 0.98 |
| 1420 | 34 | Gaffney | SC | 12,528 | 8.06 | 39.43 | 97.86 | 1.05 |
| 1419 | 33 | Greenwood | SC | 23,427 | 14.26 | 28.64 | 87.46 | 1.12 |
| 1418 | 32 | Spartanburg | SC | 37,754 | 12 | 28.95 | 96.86 | 1.19 |
| 1417 | 31 | Florence | SC | 37,640 | 12.04 | 27.84 | 98.35 | 1.26 |
| 1416 | 34 | South Salt Lake | UT | 25,599 | 7.97 | 25.86 | 122.11 | 1.33 |
| 1415 | 53 | Dyersburg | TN | 16,300 | 11.04 | 38.65 | 80.43 | 1.39 |
| 1414 | 6 | Wilmington | DE | 70,624 | 15.33 | 26.27 | 82.28 | 1.46 |
| 1413 | 31 | Jacksonville | AR | 28,273 | 9.41 | 36.04 | 92.07 | 1.53 |
| 1412 | 19 | Wichita | KS | 390,080 | 11.35 | 30.63 | 92.38 | 1.6 |
| 1411 | 132 | Highland Park | MI | 10,703 | 20.18 | 26.35 | 53.91 | 1.67 |
| 1410 | 52 | Athens | TN | 13,879 | 8.36 | 32.13 | 97.2 | 1.74 |
| 1409 | 30 | Forest Acres | SC | 10,320 | 7.75 | 34.3 | 95.16 | 1.81 |
| 1408 | 131 | Kalamazoo | MI | 76,827 | 11.94 | 35.6 | 71.32 | 1.88 |
| 1407 | 29 | North Charleston | SC | 115,312 | 9.58 | 33.9 | 82.92 | 1.95 |
| 1406 | 51 | Cleveland | TN | 45,453 | 9.99 | 31.33 | 83.98 | 2.02 |
| 1405 | 50 | Millington | TN | 10,669 | 9.75 | 29.62 | 87.92 | 2.09 |
| 1404 | 58 | Reidsville | NC | 13,959 | 7.31 | 31.88 | 95.35 | 2.16 |
No Carolina city cracked the top 100 in America, but a handful in North Carolina earned a spot among the top 220 safest cities, including; Holly Springs at #138, Pinehurst at #154, Elon at #170, Wake Forest at #182, Davidson at #212, and Cary at #214. Charlotte came in at #1293 in the nation.
| 138 | 1 | Holly Springs | NC | 38,577 | 0.62 | 3.01 | 11.66 | 90.38 |
| 139 | 17 | Beverly Hills | MI | 10,429 | 0.19 | 2.21 | 15.44 | 90.31 |
| 140 | 20 | Solon | OH | 22,830 | 0.44 | 2.54 | 13.58 | 90.24 |
| 141 | 18 | Independence Township | MI | 37,101 | 0.89 | 3.88 | 8.65 | 90.18 |
| 142 | 50 | Ashland | MA | 17,742 | 1.07 | 2.76 | 10.09 | 90.11 |
| 143 | 19 | Birmingham | MI | 21,479 | 0.47 | 2.51 | 13.69 | 90.04 |
| 144 | 21 | Montgomery | OH | 10,867 | 0.37 | 2.12 | 15 | 89.97 |
| 145 | 22 | Upper Arlington | OH | 35,754 | 0.39 | 1.23 | 16.7 | 89.9 |
| 146 | 6 | Portsmouth | RI | 17,330 | 0.52 | 4.73 | 9.17 | 89.83 |
| 147 | 9 | Lockhart | TX | 14,079 | 0.14 | 2.34 | 15.84 | 89.76 |
| 148 | 19 | Shelton | CT | 41,287 | 0.51 | 3.58 | 11.58 | 89.69 |
| 149 | 20 | Ledyard | CT | 14,698 | 0.2 | 4.9 | 10.48 | 89.62 |
| 150 | 51 | Lakeville | MA | 11,419 | 1.31 | 2.63 | 9.63 | 89.55 |
| 151 | 2 | Camas | WA | 24,388 | 0.41 | 2.34 | 14.76 | 89.48 |
| 152 | 20 | Green Oak Township | MI | 19,075 | 0.73 | 3.2 | 11.48 | 89.41 |
| 153 | 52 | Melrose | MA | 28,120 | 1.14 | 2.77 | 10.35 | 89.34 |
| 154 | 2 | Pinehurst | NC | 16,522 | 0.54 | 3.03 | 12.89 | 89.27 |
| 155 | 21 | Avon | CT | 18,320 | 0.22 | 1.26 | 18.07 | 89.2 |
| 156 | 9 | Holmen | WI | 10,217 | 0.88 | 1.76 | 14 | 89.13 |
| 157 | 53 | Littleton | MA | 10,334 | 1.06 | 4.26 | 8.23 | 89.06 |
| 158 | 21 | Plymouth Township | MI | 27,020 | 0.63 | 3.18 | 12.62 | 88.99 |
| 159 | 54 | Dracut | MA | 31,786 | 0.94 | 4.28 | 8.87 | 88.92 |
| 160 | 2 | Mount Washington | KY | 14,855 | 0.54 | 3.5 | 12.52 | 88.85 |
| 161 | 1 | Somerton | AZ | 16,771 | 1.49 | 2.86 | 9.06 | 88.78 |
| 162 | 10 | Lakeway | TX | 16,248 | 0.49 | 3.14 | 13.6 | 88.71 |
| 163 | 23 | Dublin | OH | 49,626 | 0.5 | 3.59 | 12.69 | 88.64 |
| 164 | 3 | Maple Valley | WA | 27,705 | 0.54 | 2.38 | 14.94 | 88.57 |
| 165 | 55 | Wrentham | MA | 11,989 | 0.33 | 1.5 | 17.85 | 88.5 |
| 166 | 7 | Cumberland | RI | 35,206 | 0.65 | 3.12 | 13.12 | 88.43 |
| 167 | 56 | Charlton | MA | 13,679 | 0.58 | 4.61 | 10.75 | 88.36 |
| 168 | 57 | Dedham | MA | 25,203 | 0.24 | 1.67 | 18.37 | 88.29 |
| 169 | 3 | Waukee | IA | 24,255 | 0.54 | 3.55 | 13.15 | 88.22 |
| 170 | 3 | Elon | NC | 12,214 | 0.65 | 3.68 | 12.28 | 88.15 |
| 171 | 11 | Celina | TX | 13,977 | 0.86 | 4.15 | 10.37 | 88.08 |
| 172 | 22 | Brookfield | CT | 17,071 | 0.23 | 4.16 | 13.53 | 88.01 |
| 173 | 22 | White Lake Township | MI | 31,556 | 0.76 | 3.71 | 11.82 | 87.95 |
| 174 | 10 | Greendale | WI | 14,057 | 0.78 | 2.06 | 15.01 | 87.88 |
| 175 | 23 | Bloomfield Township | MI | 42,326 | 0.24 | 3.1 | 15.71 | 87.81 |
| 176 | 3 | Lawrenceburg | KY | 11,538 | 0.35 | 3.55 | 14.39 | 87.74 |
| 177 | 24 | Mayfield Heights | OH | 18,519 | 0.65 | 3.13 | 13.77 | 87.67 |
| 178 | 24 | Flushing Township | MI | 10,174 | 0.59 | 6.59 | 7.18 | 87.6 |
| 179 | 23 | Plainfield | CT | 15,145 | 1.06 | 6.87 | 4.36 | 87.53 |
| 180 | 25 | New Baltimore | MI | 12,444 | 0.32 | 6.03 | 9.72 | 87.46 |
| 181 | 2 | Windham | NH | 14,876 | 0.34 | 4.97 | 11.83 | 87.39 |
| 182 | 4 | Wake Forest | NC | 46,145 | 0.52 | 2.95 | 15 | 87.32 |
| 183 | 8 | East Greenwich | RI | 13,119 | 0.38 | 2.9 | 15.85 | 87.25 |
| 184 | 9 | Barrington | RI | 16,090 | 0.25 | 3.11 | 16.1 | 87.18 |
| 185 | 24 | Guilford | CT | 22,194 | 0.41 | 0.99 | 19.64 | 87.11 |
| 186 | 58 | Hingham | MA | 23,960 | 1.13 | 2.34 | 13.4 | 87.04 |
| 187 | 59 | Acushnet | MA | 10,533 | 0.95 | 4.75 | 9.49 | 86.97 |
| 188 | 2 | Pleasant View | UT | 11,137 | 0.36 | 4.76 | 12.48 | 86.9 |
| 189 | 4 | Oak Harbor | WA | 23,554 | 1.32 | 4.46 | 8.32 | 86.83 |
| 190 | 26 | West Bloomfield Township | MI | 66,067 | 0.58 | 4.19 | 12.62 | 86.76 |
| 191 | 11 | De Pere | WI | 25,163 | 0.72 | 3.02 | 14.39 | 86.69 |
| 192 | 4 | Urbandale | IA | 44,541 | 0.61 | 2.56 | 15.96 | 86.62 |
| 193 | 25 | Darien | CT | 21,880 | 0.14 | 1.28 | 20.89 | 86.55 |
| 194 | 1 | West Linn | OR | 26,962 | 0.48 | 2.3 | 17.17 | 86.48 |
| 195 | 25 | Miami Township, Clermont County | OH | 42,764 | 0.51 | 3.23 | 15.18 | 86.41 |
| 196 | 5 | Kenmore | WA | 23,430 | 0.77 | 3.03 | 14.34 | 86.34 |
| 197 | 12 | Prosper | TX | 24,814 | 0.56 | 3.91 | 13.66 | 86.27 |
| 198 | 60 | Tyngsboro | MA | 12,456 | 1.36 | 3.61 | 10.28 | 86.2 |
| 199 | 26 | New Franklin | OH | 14,162 | 0.56 | 5.86 | 9.81 | 86.13 |
| 200 | 12 | New Berlin | WI | 39,752 | 0.5 | 2.09 | 17.71 | 86.06 |
| 201 | 26 | Waterford | CT | 18,812 | 0.43 | 4.2 | 13.93 | 85.99 |
| 202 | 27 | Delhi Township | OH | 29,811 | 0.7 | 2.99 | 15.1 | 85.92 |
| 203 | 10 | Narragansett | RI | 15,411 | 0.84 | 3.18 | 14.02 | 85.85 |
| 204 | 27 | Vernon | CT | 29,318 | 0.51 | 3.31 | 15.45 | 85.78 |
| 205 | 28 | Winchester | CT | 10,585 | 0.57 | 2.83 | 16.25 | 85.72 |
| 206 | 13 | Elgin | TX | 10,475 | 0.67 | 3.25 | 14.99 | 85.65 |
| 207 | 14 | Sachse | TX | 26,926 | 0.48 | 6.09 | 10.32 | 85.58 |
| 208 | 11 | South Kingstown | RI | 30,656 | 0.49 | 4.63 | 13.31 | 85.51 |
| 209 | 28 | Loveland | OH | 13,245 | 1.21 | 4.23 | 10.57 | 85.44 |
| 210 | 6 | Bainbridge Island | WA | 25,080 | 0.4 | 3.31 | 16.47 | 85.37 |
| 211 | 27 | Clawson | MI | 11,948 | 0.59 | 6.86 | 8.45 | 85.3 |
| 212 | 5 | Davidson | NC | 13,193 | 0.61 | 3.49 | 15.16 | 85.23 |
| 213 | 4 | Independence | KY | 28,541 | 0.42 | 7.43 | 8.23 | 85.16 |
| 214 | 6 | Cary | NC | 172,525 | 0.64 | 3.62 | 14.83 | 85.09 |
| 215 | 15 | Canyon | TX | 16,312 | 0.86 | 4.29 | 12.44 | 85.02 |
| 216 | 61 | Amherst | MA | 39,603 | 2.47 | 2.93 | 7.22 | 84.95 |
| 217 | 62 | Wilmington | MA | 23,915 | 1.34 | 3.01 | 12.8 | 84.88 |
| 218 | 63 | Longmeadow | MA | 15,737 | 0.57 | 2.61 | 17.47 | 84.81 |
| 219 | 2 | Sherwood | OR | 19,865 | 0.6 | 1.96 | 18.68 | 84.74 |
| 220 | 29 | South Windsor | CT | 26,097 | 0.5 | 2.72 | 17.86 | 84.67 |
What do you think about the results?
