
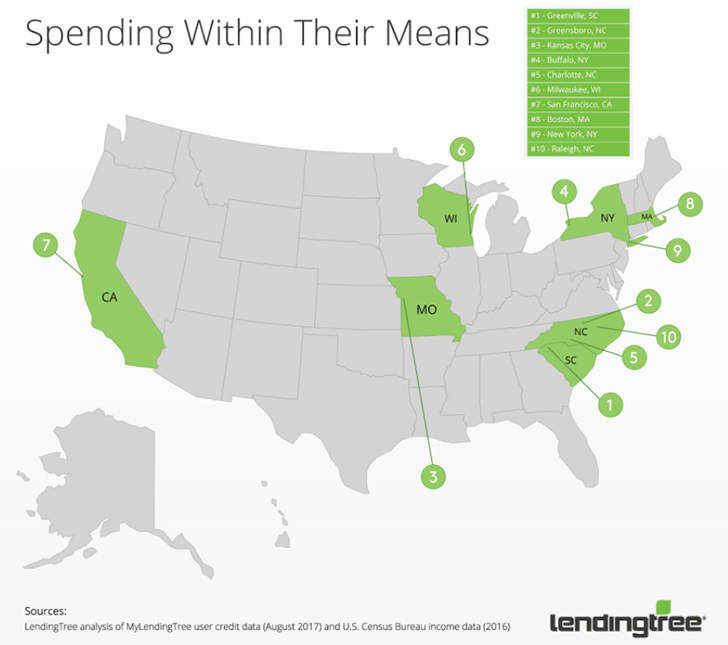
LendingTree just released their findings from a new study on how well residents in the top 50 U.S. metropolitan areas are spending within their means – or not.
The company analyzed the average number of credit inquiries, use of revolving credit, non-housing debt balances as a percentage of income and mortgage balances (also as a percentage of income). The study then combined these factors to create a “Spending Within Your Means Score” of 0 to 100, with a higher score designating the cities where residents are more likely to be living within their means.
Greenville, SC took the top score, despite having the second-lowest average income among the 50 cities ranked at $65,503 per household. Greensboro, NC, came in at the #2, Charlotte came in at #5, and Raleigh was ranked #10 – proving that Carolina residents are by far the wisest credit users in the country;
Among the 50 ranked metro areas, residents are, on average, using 30 percent of their revolving credit lines — such as credit cards and home equity lines of credit, or HELOCs. They also have mortgage balances averaging 79 percent of their annual income and non-housing debt balances averaging 44 percent of annual income, and have had five credit inquiries in the last two years.
| Rank | Metro | Spending Within Their Means Score | Inquiries (last 2 years) | Revolving Credit Utilization | Non-Housing Debt % of Income | Mortgage Debt % of Income |
| 1 | Greenville, SC | 71 | 4.0 | 27.6% | 47.3% | 61.6% |
| 2 | Greensboro, NC | 65 | 3.8 | 28.9% | 48.5% | 63.9% |
| 3 | Kansas City, MO | 64 | 5.9 | 28.4% | 42.8% | 65.0% |
| 4 | Buffalo, NY | 64 | 4.0 | 29.0% | 50.5% | 55.2% |
| 5 | Charlotte, NC | 64 | 3.8 | 28.2% | 43.2% | 84.9% |
| 6 | Milwaukee, WI | 64 | 7.1 | 28.4% | 39.7% | 65.8% |
| 7 | San Francisco, CA | 63 | 3.9 | 28.9% | 28.4% | 109.1% |
| 8 | Boston, MA | 62 | 4.6 | 29.0% | 35.7% | 86.9% |
| 9 | New York, NY | 62 | 4.4 | 30.5% | 34.7% | 77.6% |
| 10 | Raleigh, NC | 61 | 3.8 | 27.6% | 45.2% | 85.6% |
| 11 | Pittsburgh, PA | 60 | 5.1 | 28.0% | 51.2% | 49.3% |
| 12 | Nashville, TN | 59 | 4.4 | 27.8% | 43.9% | 80.4% |
| 13 | Hartford, CT | 58 | 5.5 | 30.0% | 38.1% | 76.8% |
| 14 | Oklahoma City, OK | 58 | 6.0 | 28.3% | 47.8% | 60.7% |
| 15 | Portland | 56 | 3.5 | 30.0% | 40.2% | 90.8% |
| 16 | Grand Rapids, MI | 56 | 6.8 | 29.4% | 43.3% | 59.8% |
| 17 | Detroit, MI | 56 | 5.9 | 30.1% | 41.0% | 65.0% |
| 18 | Louisville, KY | 56 | 6.8 | 28.3% | 43.0% | 68.4% |
| 19 | Washington, DC | 55 | 4.0 | 30.1% | 37.1% | 102.8% |
| 20 | Richmond, VA | 55 | 4.0 | 29.8% | 41.2% | 87.5% |
| 21 | Denver, CO | 55 | 3.1 | 29.2% | 39.9% | 108.0% |
| 22 | St. Louis, MO | 53 | 7.7 | 29.0% | 42.8% | 67.0% |
| 23 | Philadelphia, PA | 53 | 5.6 | 28.9% | 43.0% | 79.4% |
| 24 | Minneapolis, MN | 53 | 4.3 | 30.5% | 39.5% | 83.6% |
| 25 | Birmingham, AL | 53 | 5.6 | 29.2% | 47.3% | 62.5% |
| 26 | Cincinnati, OH | 53 | 5.7 | 29.1% | 44.9% | 68.0% |
| 27 | Cleveland, OH | 52 | 6.6 | 28.9% | 49.4% | 58.9% |
| 28 | Austin, TX | 52 | 4.9 | 30.0% | 42.5% | 78.2% |
| 29 | Dallas – Fort Worth, TX | 52 | 5.1 | 29.5% | 44.3% | 69.9% |
| 30 | Indianapolis, IN | 51 | 6.6 | 28.4% | 46.1% | 68.3% |
| 31 | Atlanta, GA | 51 | 4.3 | 29.2% | 45.0% | 81.2% |
| 32 | Columbus, OH | 49 | 6.2 | 30.6% | 45.9% | 57.4% |
| 33 | Salt Lake City, UT | 48 | 4.2 | 30.2% | 39.7% | 98.2% |
| 34 | Chicago, IL | 46 | 7.2 | 30.1% | 39.5% | 80.1% |
| 35 | Seattle, WA | 46 | 4.6 | 30.6% | 37.6% | 98.7% |
| 36 | Memphis, TN | 45 | 5.1 | 29.7% | 51.2% | 64.9% |
| 37 | New Orleans, LA | 43 | 4.2 | 30.8% | 50.8% | 66.9% |
| 38 | Miami, FL | 43 | 4.1 | 29.0% | 48.7% | 89.5% |
| 39 | Harrisburg, PA | 42 | 6.2 | 29.1% | 47.8% | 70.1% |
| 40 | Sacramento, CA | 42 | 4.4 | 32.0% | 38.5% | 103.2% |
| 41 | San Diego, CA | 41 | 4.3 | 32.8% | 37.2% | 118.2% |
| 42 | Los Angeles, CA | 39 | 4.6 | 32.0% | 38.6% | 108.3% |
| 43 | Houston, TX | 39 | 5.3 | 31.4% | 46.8% | 70.3% |
| 44 | Tampa, FL | 38 | 4.2 | 29.9% | 51.6% | 80.7% |
| 45 | Virginia Beach, VA | 36 | 3.8 | 33.2% | 46.8% | 95.4% |
| 46 | Orlando, FL | 31 | 4.3 | 30.7% | 51.0% | 82.1% |
| 47 | Jacksonville, FL | 25 | 4.1 | 32.3% | 51.8% | 87.9% |
| 48 | Phoenix, AZ | 25 | 5.1 | 30.4% | 48.1% | 102.7% |
| 49 | Las Vegas, NV | 20 | 5.1 | 31.8% | 50.6% | 96.6% |
| 50 | San Antonio, TX | 19 | 7.3 | 32.1% | 54.7% | 72.2% |
For more information on the study visit www.lendingtree.com/finance/cities-spending-within-their-means.
