 Homebuyers are finding themselves in a tough spot. With mortgage rates now over 6.0% and unlikely to fall in 2023, the cost of buying a home has dramatically increased.
But the mortgage payment is not the only concern. Other expenses such as closing costs, taxes and insurance can take a lot out of a buyer’s budget.
In a new study, SmartAsset examined how much the first year of homeownership costs in the 20 largest U.S. cities, comparing 2022 data across several metrics related to home ownership, including property taxes, home insurance, closing costs and more.
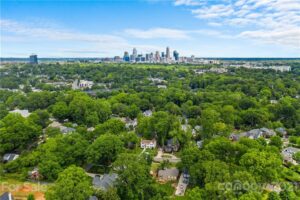
Their findings show that Charlotte ranked as the 11th most expensive city for the first year of homeownership, more expensive than even Chicago (#12) and Dallas (#13).
How Much Does the First Year of Homeownership Cost in Large U.S. Cities?
| Upfront Costs | Annual Recurring Costs | Year 1: | |||||
|---|---|---|---|---|---|---|---|
| 1 | San Francisco, CA | $316,439 | $7,938 | $91,066 | $1,774 | $9,780 | $426,997 |
| 2 | San Jose, CA | $288,955 | $7,647 | $83,157 | $1,774 | $10,402 | $391,935 |
| 3 | Los Angeles, CA | $193,199 | $6,567 | $55,600 | $1,774 | $6,859 | $263,999 |
| 4 | San Diego, CA | $192,376 | $6,555 | $55,363 | $1,774 | $7,022 | $263,089 |
| 5 | Seattle, WA | $190,589 | $6,304 | $54,848 | $1,178 | $8,576 | $261,495 |
| 6 | New York, NY | $152,304 | $19,625 | $43,831 | $1,500 | $14,659 | $231,918 |
| 7 | Boston, MA | $146,771 | $5,990 | $42,238 | $1,770 | $5,064 | $201,833 |
| 8 | Austin, TX | $132,476 | $6,732 | $38,125 | $2,554 | $11,724 | $191,611 |
| 9 | Denver, CO | $125,318 | $4,863 | $36,064 | $3,383 | $3,509 | $173,137 |
| 10 | Phoenix, AZ | $84,095 | $4,248 | $24,201 | $1,378 | $2,481 | $116,403 |
| 11 | Charlotte, NC | $76,771 | $3,606 | $22,093 | $1,407 | $3,647 | $107,524 |
| 12 | Chicago, IL | $63,098 | $7,405 | $18,159 | $1,355 | $6,594 | $96,611 |
| 13 | Dallas, TX | $64,101 | $4,529 | $18,447 | $2,554 | $5,897 | $95,528 |
| 14 | Fort Worth, TX | $63,465 | $4,510 | $18,264 | $2,554 | $6,156 | $94,949 |
| 15 | San Antonio, TX | $58,059 | $4,289 | $16,708 | $2,554 | $5,777 | $87,388 |
| 16 | Jacksonville, FL | $58,876 | $5,186 | $16,943 | $1,977 | $2,649 | $85,631 |
| 17 | Houston, TX | $52,307 | $4,119 | $15,053 | $2,554 | $5,074 | $79,107 |
| 18 | Philadelphia, PA | $46,612 | $8,404 | $13,414 | $899 | $2,261 | $71,590 |
| 19 | Columbus, OH | $47,261 | $3,541 | $13,601 | $1,299 | $4,490 | $70,192 |
| 20 | Indianapolis, IN | $44,102 | $3,009 | $12,692 | $1,214 | $2,227 | $63,244 |
The full report, including key findings, methodology, and an infographic, can be found here: https://smartasset.com/data-
