In North Carolina, and especially within the Charlotte area, rising interest rates and a strong preference for high-quality spaces have introduced challenges to the office market . Nonetheless, the most premium assets in the most desirable locations, including those in Charlotte, have continued to draw substantial investments. To shed light on this trend, we analyzed CommercialEdge office sales data to pinpoint and rank the 100 most expensive office submarkets in America.
Some key findings include:
North Carolina is home to 4 of the 100 most expensive office submarkets of 2023. In terms of the number of entries on the list, it tied with New York and Virginia.
The Raleigh – Glenwood Ave submarket ranked #13 — highest among N.C. entries. Here, office space traded for an average price of $297 per square foot last year.
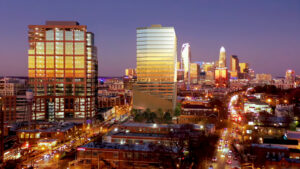
North Carolina’s other 3 entries are part of the Charlotte market: East Charlotte ranked #45, with an average sale price of $176 per square foot of office space; Southpark ranked #51 ($169 per square foot); and the Charlotte Airport submarket placed #54 ($165 per square foot).
Considering state-wide transactions (not just in the ranking submarkets), North Carolina office sale prices averaged $204 per square foot, making it one of the eight states (plus D.C.) where this value was above the national average of $193.
Top 100 Most Expensive Submarkets of 2023
1 Plaza District NY Manhattan $1,045 $1,512,535,183 1,594,034 9
2 Santa Monica CA Los Angeles $710 $175,918,500 269,129 4
3 San Francisco – SOMA CA San Francisco $570 $150,150,000 279,893 3
4 Sunnyvale – East CA Bay Area $525 $209,500,000 419,952 3
5 Washington, D.C. CBD DC Washington, D.C. – Suburban Maryland $478 $289,573,196 738,817 5
6 Santa Clarita CA Los Angeles $426 $97,500,000 262,221 3
7 Peoria AZ Phoenix $408 $70,450,000 163,799 3
8 John Wayne Airport CA Orange County $374 $84,785,000 240,820 4
9 East End DC Washington, D.C. – Suburban Maryland $330 $364,100,250 859,423 4
10 Kearny Mesa CA San Diego $311 $203,127,955 458,692 3
11 Northeast Orlando FL Orlando $311 $26,686,800 86,548 3
12 San Francisco – South Financial District CA San Francisco $309 $174,930,000 561,593 3
13 Raleigh – Glenwood Ave NC Raleigh – Durham $297 $52,975,000 178,402 3
14 Oceanside – Fallbrook CA San Diego $296 $27,900,000 94,607 3
15 Vancouver WA Portland $286 $48,642,000 171,518 4
16 Franklin TN Nashville $273 $53,358,000 191,208 4
17 Irvine Business Complex CA Orange County $268 $129,150,000 566,319 4
18 Eastern East-West Corridor IL Chicago $261 $156,175,000 1,038,243 5
19 Northwest Tampa FL Tampa – St. Petersburg – Clearwater $255 $60,015,000 240,891 4
20 Spring Valley NV Las Vegas $254 $32,900,000 131,355 4
21 Reno – Airport NV Reno $245 $25,718,000 118,112 3
22 I-287 South NJ New Jersey $238 $90,590,000 509,977 4
23 Scottsdale – Airpark AZ Phoenix $236 $110,136,495 528,278 6
24 Newton Needham Corridor MA Boston $229 $177,218,000 742,047 5
25 West Loop IL Chicago $228 $48,303,000 211,200 3
26 San Gabriel Valley CA Los Angeles $226 $115,850,000 495,139 8
27 Rockland County NY White Plains $222 $56,510,279 300,086 3
28 Downtown CA Sacramento $212 $104,800,000 538,133 4
29 Southwest Cook County IL Chicago $210 $69,855,500 222,014 4
30 Plantation FL Fort Lauderdale $209 $88,318,400 455,392 5
31 Chandler AZ Phoenix $208 $57,150,000 291,575 4
32 Westshore FL Tampa – St. Petersburg – Clearwater $207 $125,971,000 607,259 7
33 West San Fernando Valley CA Los Angeles $198 $48,327,000 227,965 5
34 Virginia Square VA Washington, D.C. – Suburban Maryland $198 $44,400,000 333,863 3
35 Springfield – Burke VA Washington, D.C. – Suburban Maryland $195 $27,215,000 144,487 3
36 Rt 28 Corridor South VA Washington, D.C. – Suburban Maryland $194 $202,974,234 1,023,428 5
37 Downtown TN Nashville $191 $91,000,000 359,232 3
38 Langhorne – Newtown PA Philadelphia $183 $59,475,000 305,311 3
39 San Bernardino CA Inland Empire $183 $53,060,000 362,810 3
40 Westborough MA Worcester – Springfield $180 $82,096,320 532,912 5
41 Los Angeles CBD CA Los Angeles $180 $164,918,500 1,007,888 3
42 Tacoma WA Seattle $178 $55,046,000 307,964 6
43 Gateway FL Tampa – St. Petersburg – Clearwater $176 $34,550,000 240,530 3
44 South Rockville MD Washington, D.C. – Suburban Maryland $176 $30,875,000 328,385 4
45 East Charlotte NC Charlotte $176 $33,250,000 218,448 3
46 El Dorado County CA Sacramento $173 $31,723,500 199,848 3
47 Meridian CO Denver $172 $28,654,060 233,354 3
48 Fort Lauderdale – North FL Fort Lauderdale $172 $18,475,000 102,978 3
49 North Tucson – Oro Valley AZ Tucson $171 $67,064,000 320,496 3
50 Louisville – East KY Louisville $170 $38,052,580 242,850 3
51 Southpark NC Charlotte $169 $53,680,000 347,071 3
52 Henderson NV Las Vegas $169 $46,900,000 244,822 3
53 Boca Raton – North FL West Palm Beach – Boca Raton $168 $134,750,000 832,637 3
54 Airport NC Charlotte $165 $60,222,500 373,239 6
55 Woodbury NY Long Island $165 $81,125,000 561,570 5
56 South Coast Metro CA Orange County $163 $60,705,000 444,504 3
57 Reston VA Washington, D.C. – Suburban Maryland $162 $94,350,000 674,437 6
58 Bridgewater NJ New Jersey $157 $39,432,563 370,995 3
59 Point West CA Sacramento $152 $21,940,000 154,694 3
60 Downtown IN Indianapolis $152 $16,992,400 127,971 3
61 I-494 Northwest MN Minneapolis – St. Paul $149 $34,450,000 290,549 3
62 East Baltimore County MD Baltimore $149 $24,250,000 163,336 3
63 East Sacramento CA Sacramento $149 $13,800,000 89,467 3
64 Keystone IN Indianapolis $146 $38,684,910 257,247 4
65 Colorado Springs CO Denver $143 $17,340,000 141,816 3
66 East Tampa FL Tampa – St. Petersburg – Clearwater $141 $56,485,000 469,030 4
67 Roseville – Rocklin CA Sacramento $139 $51,703,500 336,335 4
68 Centennial CO Denver $137 $82,894,000 597,376 5
69 Hoover AL Birmingham $136 $49,100,000 391,600 3
70 Cedar Bluff – Hardin Valley TN Knoxville $136 $83,647,422 717,439 6
71 Novato CA San Francisco $135 $14,960,000 112,623 3
72 Cranford – Union NJ New Jersey $133 $212,752,549 2,184,283 6
73 Bergen County North NJ New Jersey $130 $37,750,750 306,389 4
74 Stockton – San Joaquin County CA Central Valley $128 $15,980,000 153,161 3
75 Mesa AZ Phoenix $126 $35,724,500 294,705 5
76 Chicago CBD IL Chicago $124 $154,850,000 1,255,679 5
77 Harford County MD Baltimore $122 $17,725,000 148,936 3
78 Tempe AZ Phoenix $122 $78,453,360 656,061 7
79 New London CT Bridgeport – New Haven $119 $14,850,000 117,529 3
80 Phoenix – Central Corridor AZ Phoenix $118 $34,900,000 353,168 3
81 Harrison – Purchase NY White Plains $118 $110,900,000 825,036 4
82 Johnson County IN Indianapolis $117 $18,466,440 148,494 3
83 Gaithersburg MD Washington, D.C. – Suburban Maryland $114 $26,775,000 231,015 4
84 Western East-West Corridor IL Chicago $109 $55,504,000 565,820 6
85 North Shore – South IL Chicago $108 $21,243,000 370,088 5
86 Minneapolis – Central Business District MN Minneapolis – St. Paul $108 $285,700,000 1,643,984 5
87 Columbia MD Baltimore $108 $15,471,200 152,282 3
88 Phoenix – Deer Valley AZ Phoenix $107 $79,700,000 643,080 5
89 Northeast Tampa FL Tampa – St. Petersburg – Clearwater $103 $47,175,000 475,617 3
90 Ramsey County – North MN Minneapolis – St. Paul $100 $14,013,965 142,968 4
91 Parsippany NJ New Jersey $100 $75,845,390 813,167 4
92 Peachtree Corners – Duluth GA Atlanta $100 $42,625,000 493,724 5
93 Pasco County FL Tampa – St. Petersburg – Clearwater $98 $13,050,000 131,345 4
94 Arlington Heights – Lake Zurich IL Chicago $97 $75,398,000 745,054 5
95 Highway 50 Corridor CA Sacramento $94 $60,526,000 751,776 9
96 Alpharetta GA Atlanta $93 $28,575,000 261,508 3
97 North Shore – North IL Chicago $91 $55,286,000 548,520 6
98 I-90 Golden Corridor IL Chicago $90 $170,384,500 2,379,585 16
99 Trenton NJ New Jersey $89 $26,250,000 378,822 4
100 Quincy – Braintree MA Boston $88 $20,490,928 286,427 3

 Despite a general slowdown in US office sales, the sector witnessed significant investments, particularly in North Carolina, where over $33 billion in assets were exchanged last year at an impressive average sale price of nearly $200 per square foot.